- All Foundries

- Commodity Management & Trading

- Customer & Marketing Strategy

- Digital Engineering

- Station Studio

- Supply Chain & Industry 5.0
- Sustainability

- Physical AI

- Next-Gen Infrastructure


All Foundries
Commodity Management & Trading
Transforming trading ecosystems through data-driven insights and secure, agile platforms that empower global commerce.

Customer & Marketing Strategy
Reimagining customer engagement with personalized, connected experiences that build trust and long-term value.
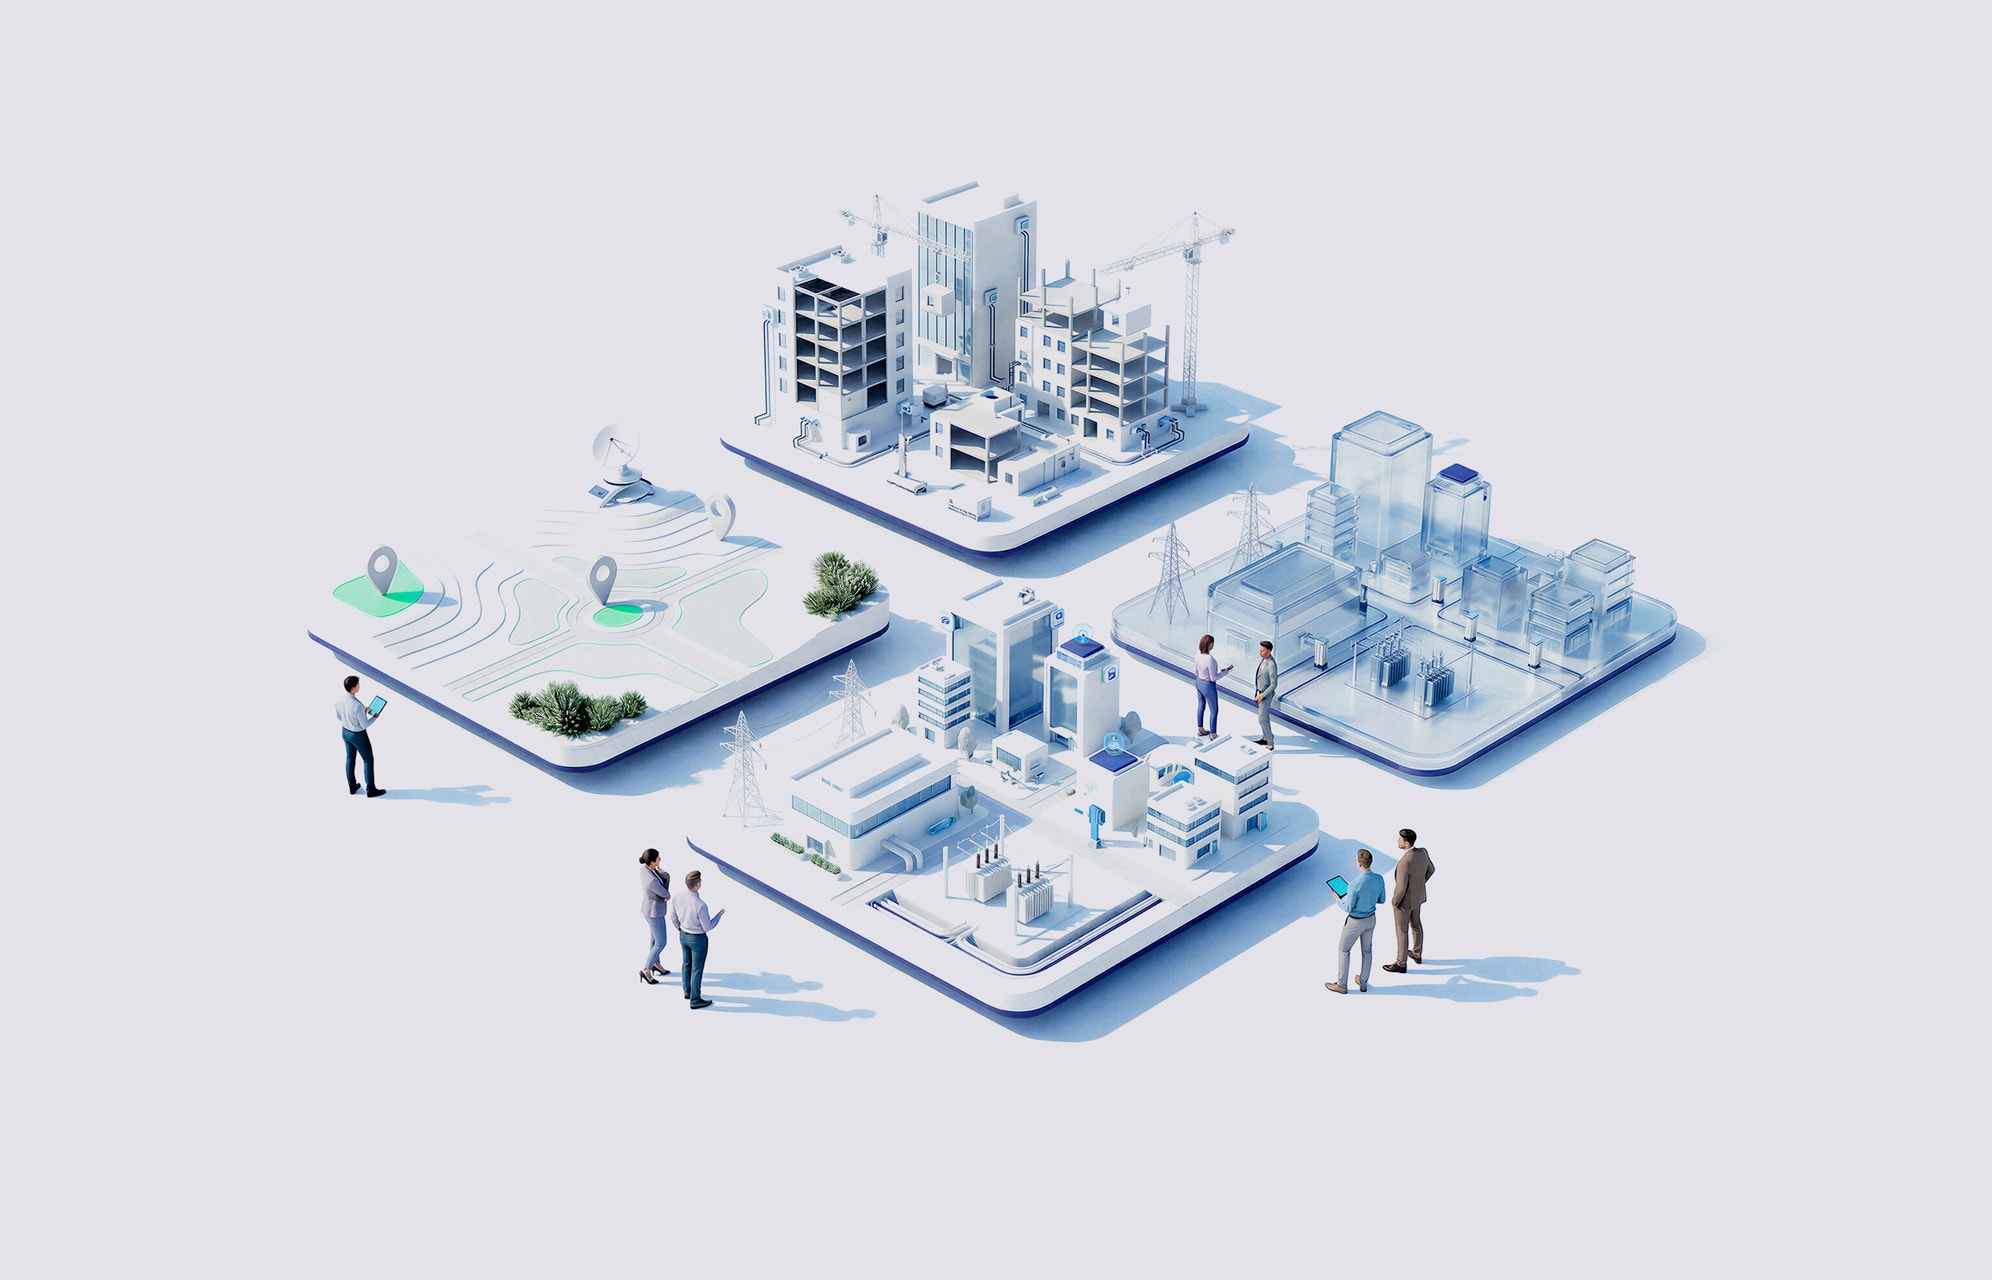
Digital Engineering
Turning ideas into scalable digital solutions—accelerating transformation through design, technology, and engineering excellence.
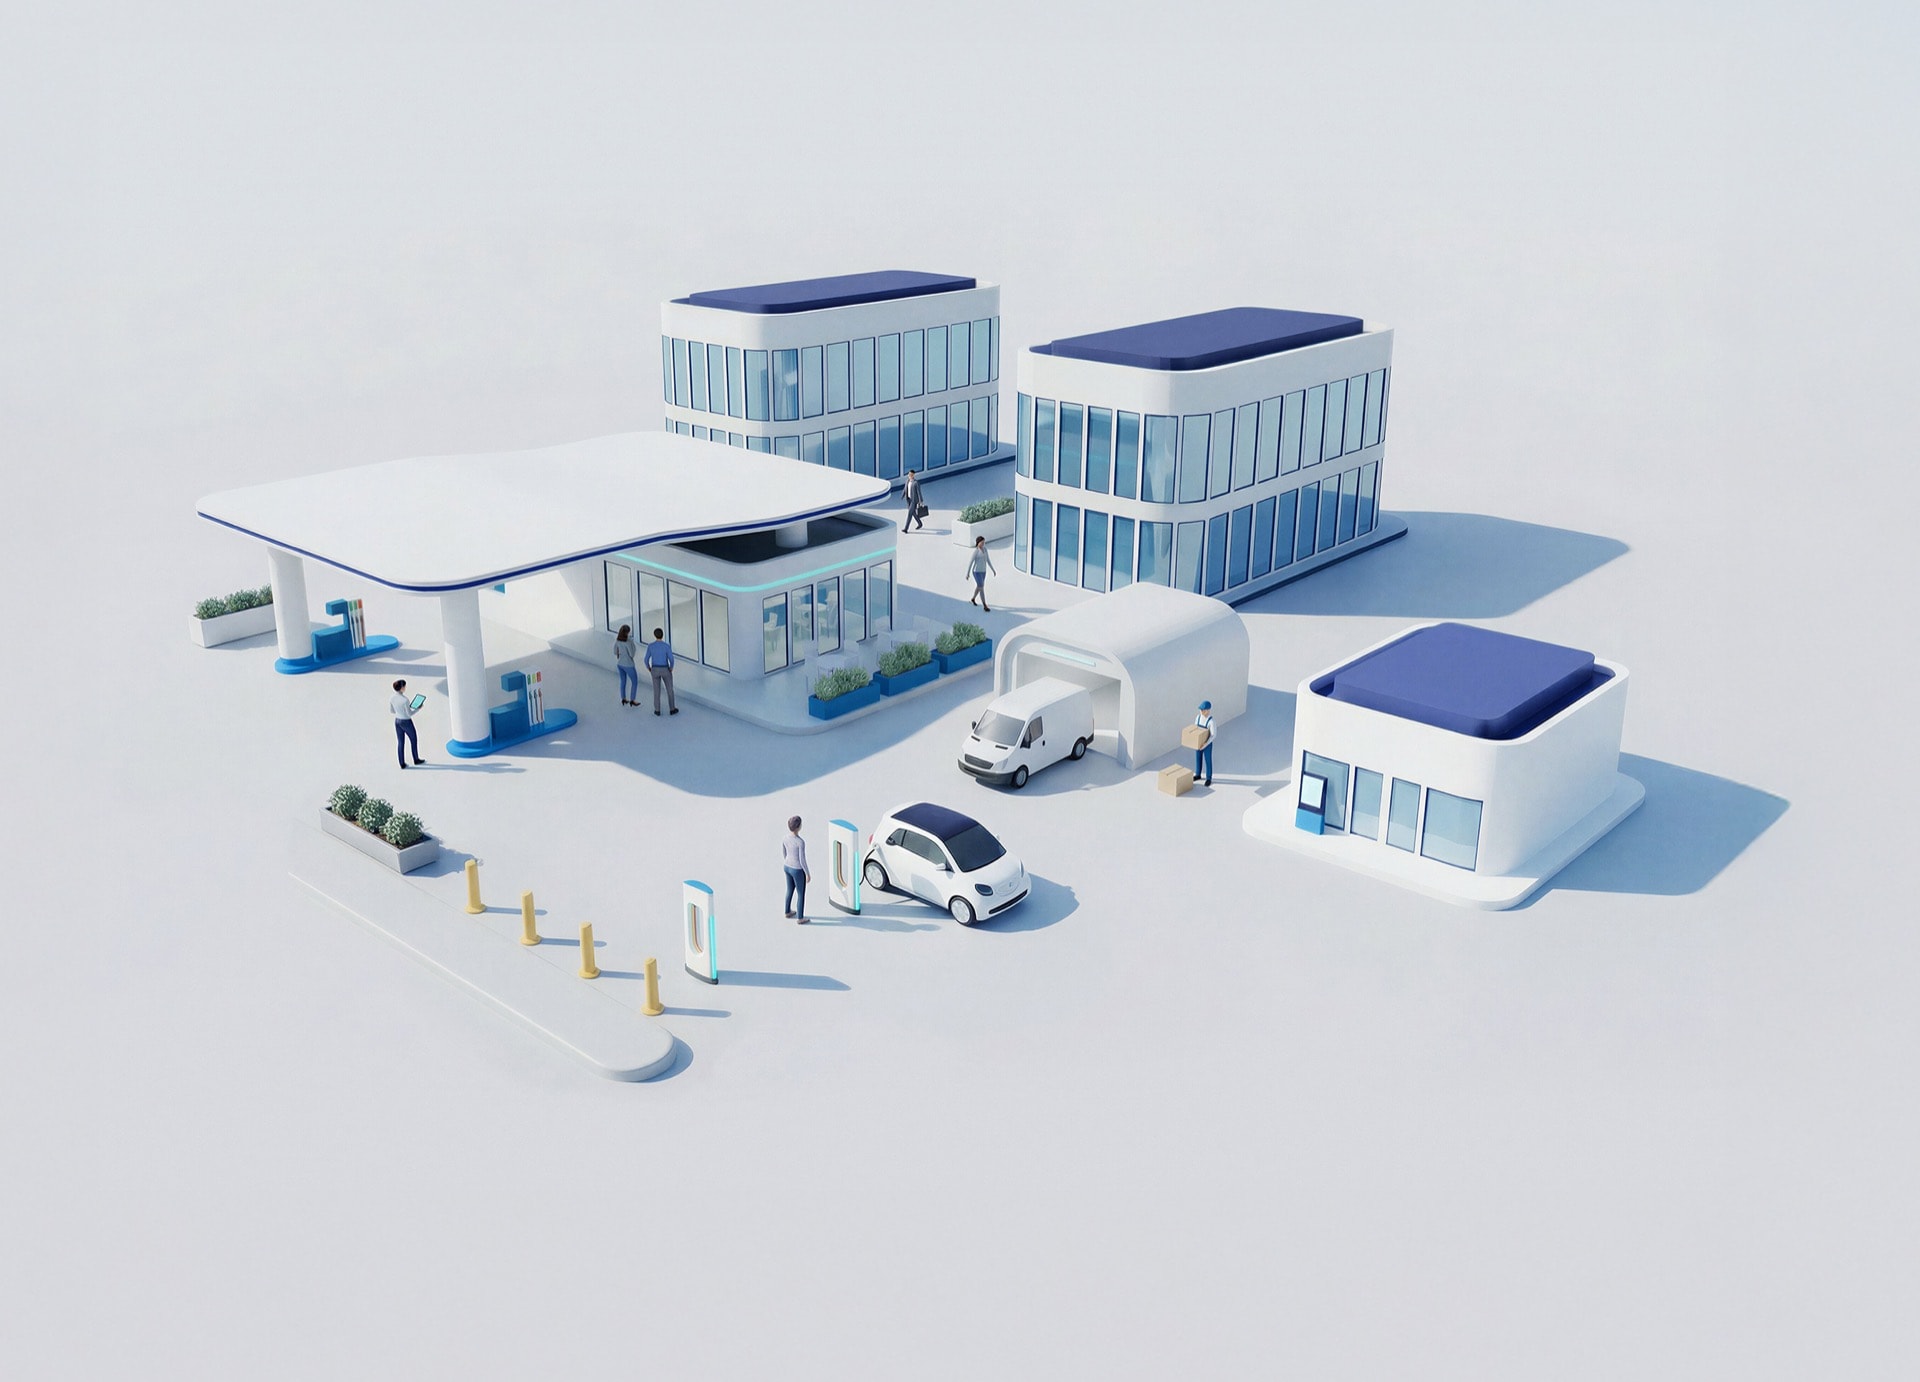
Station Studio
Redefining mobility hubs with digital innovation to create smarter, sustainable experiences for people and businesses on the move.
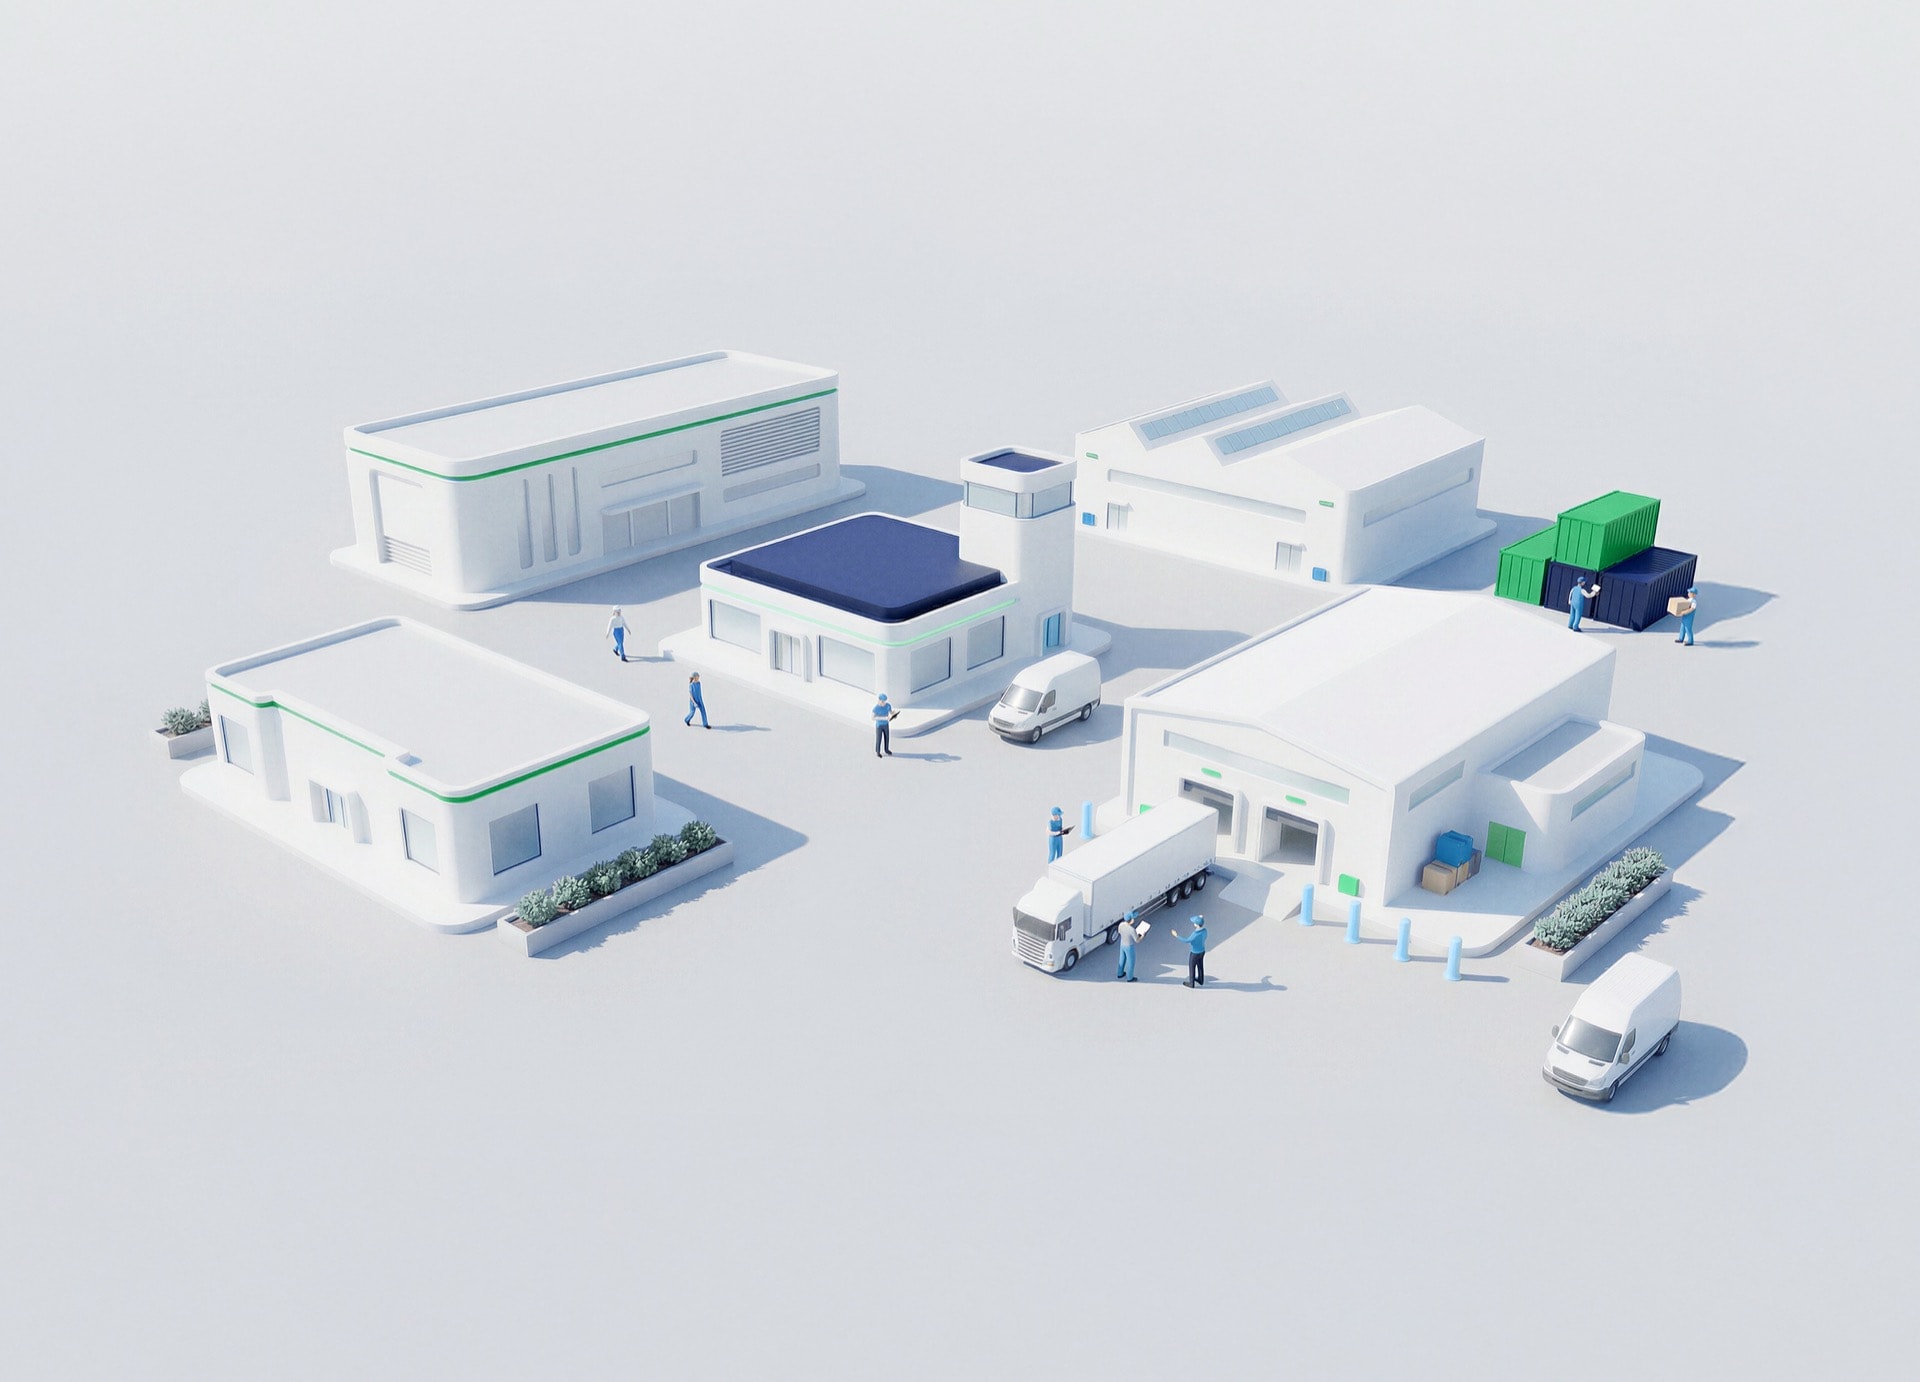
Supply Chain & Industry 5.0
Building resilient, intelligent supply networks that anticipate change and deliver efficiency with purpose.
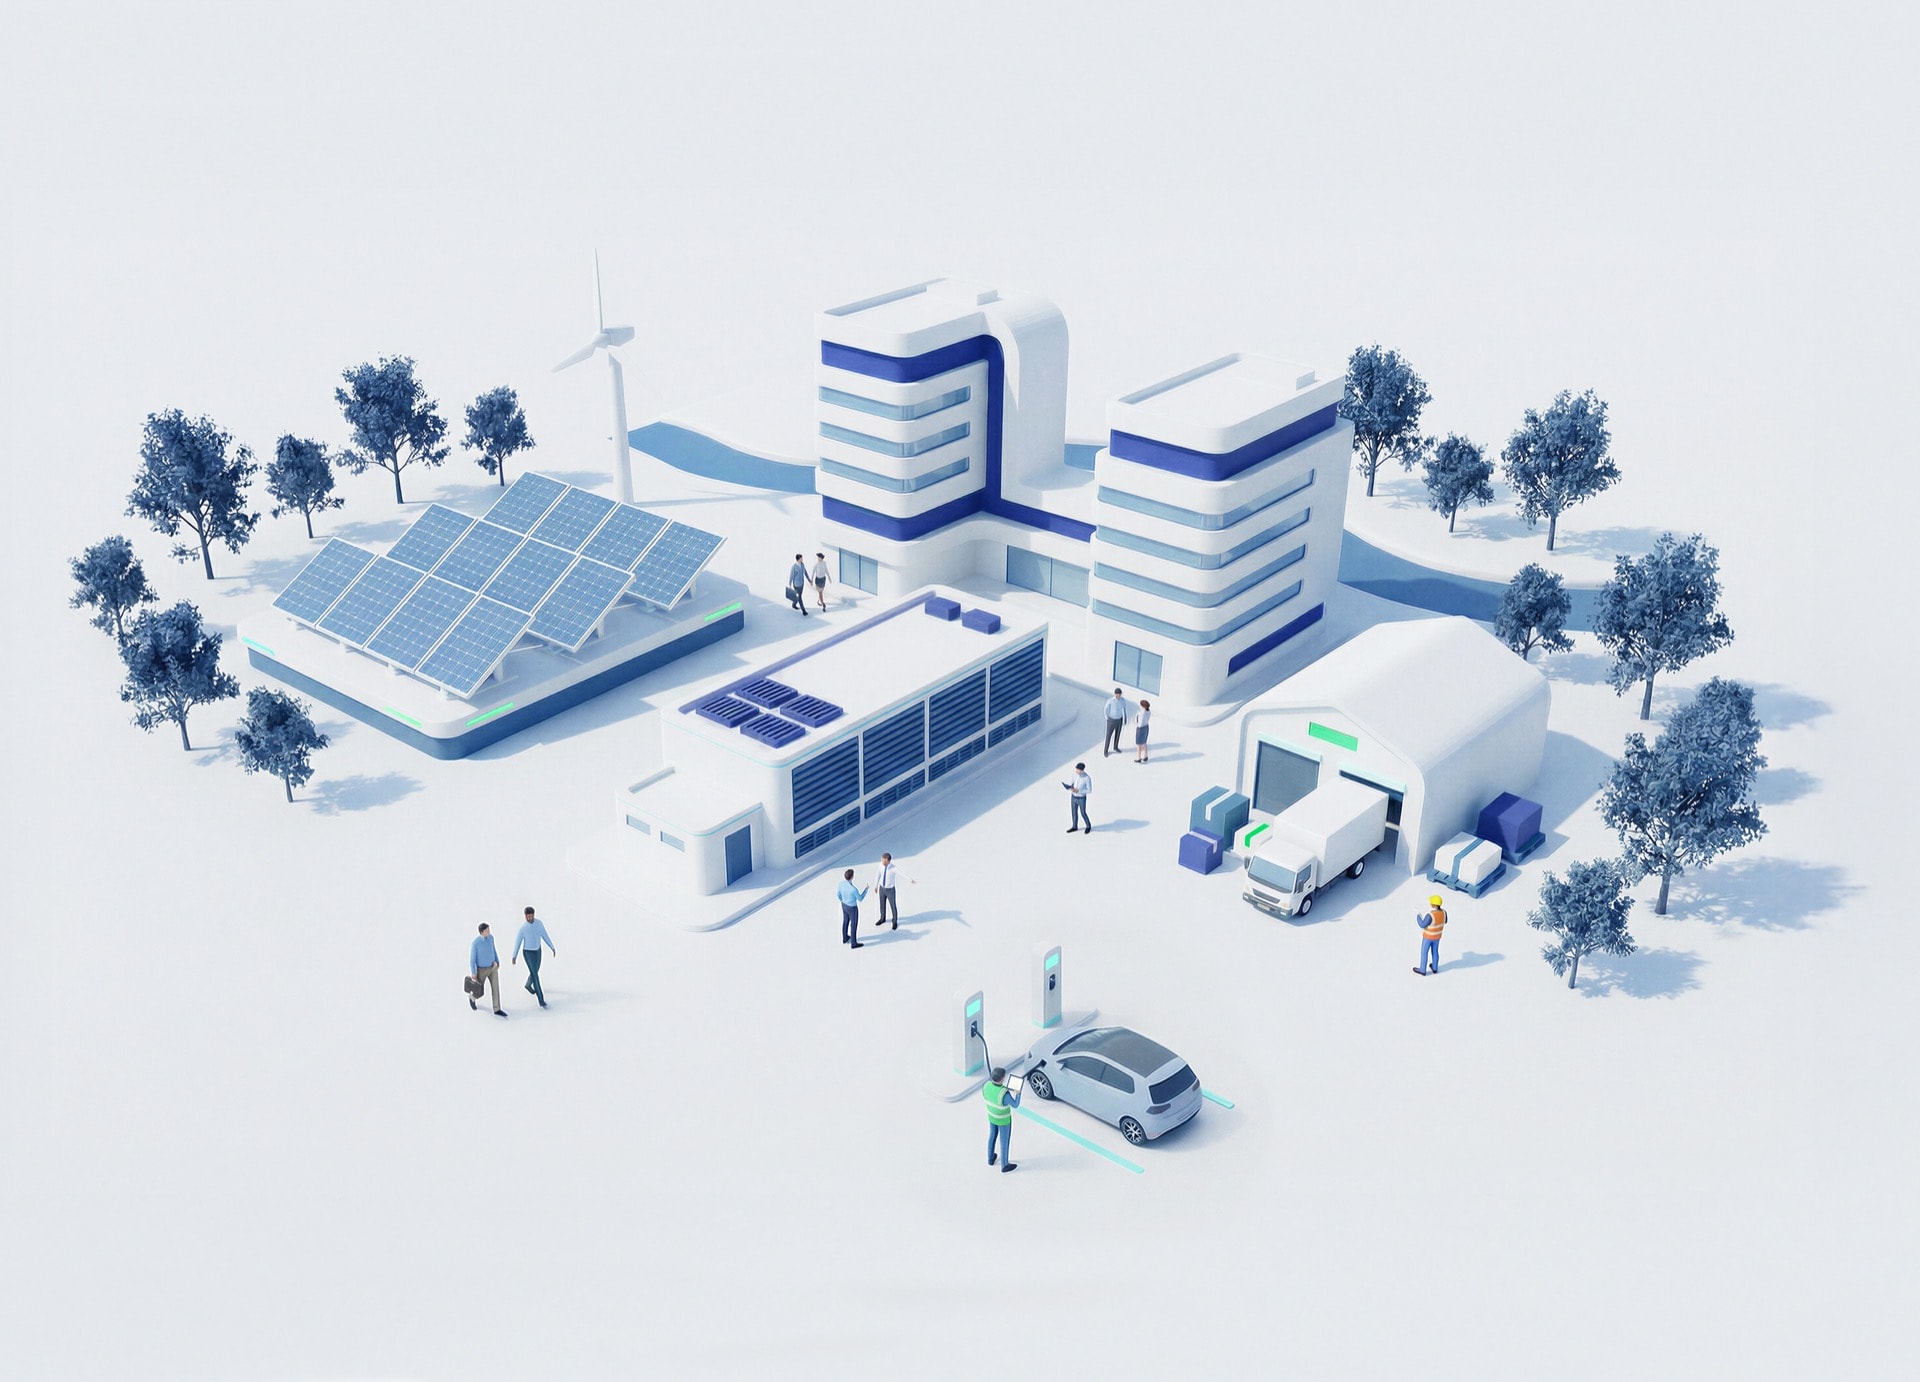
Sustainability
Driving responsible innovation to help organizations achieve net-zero goals and create a positive impact for future generations.
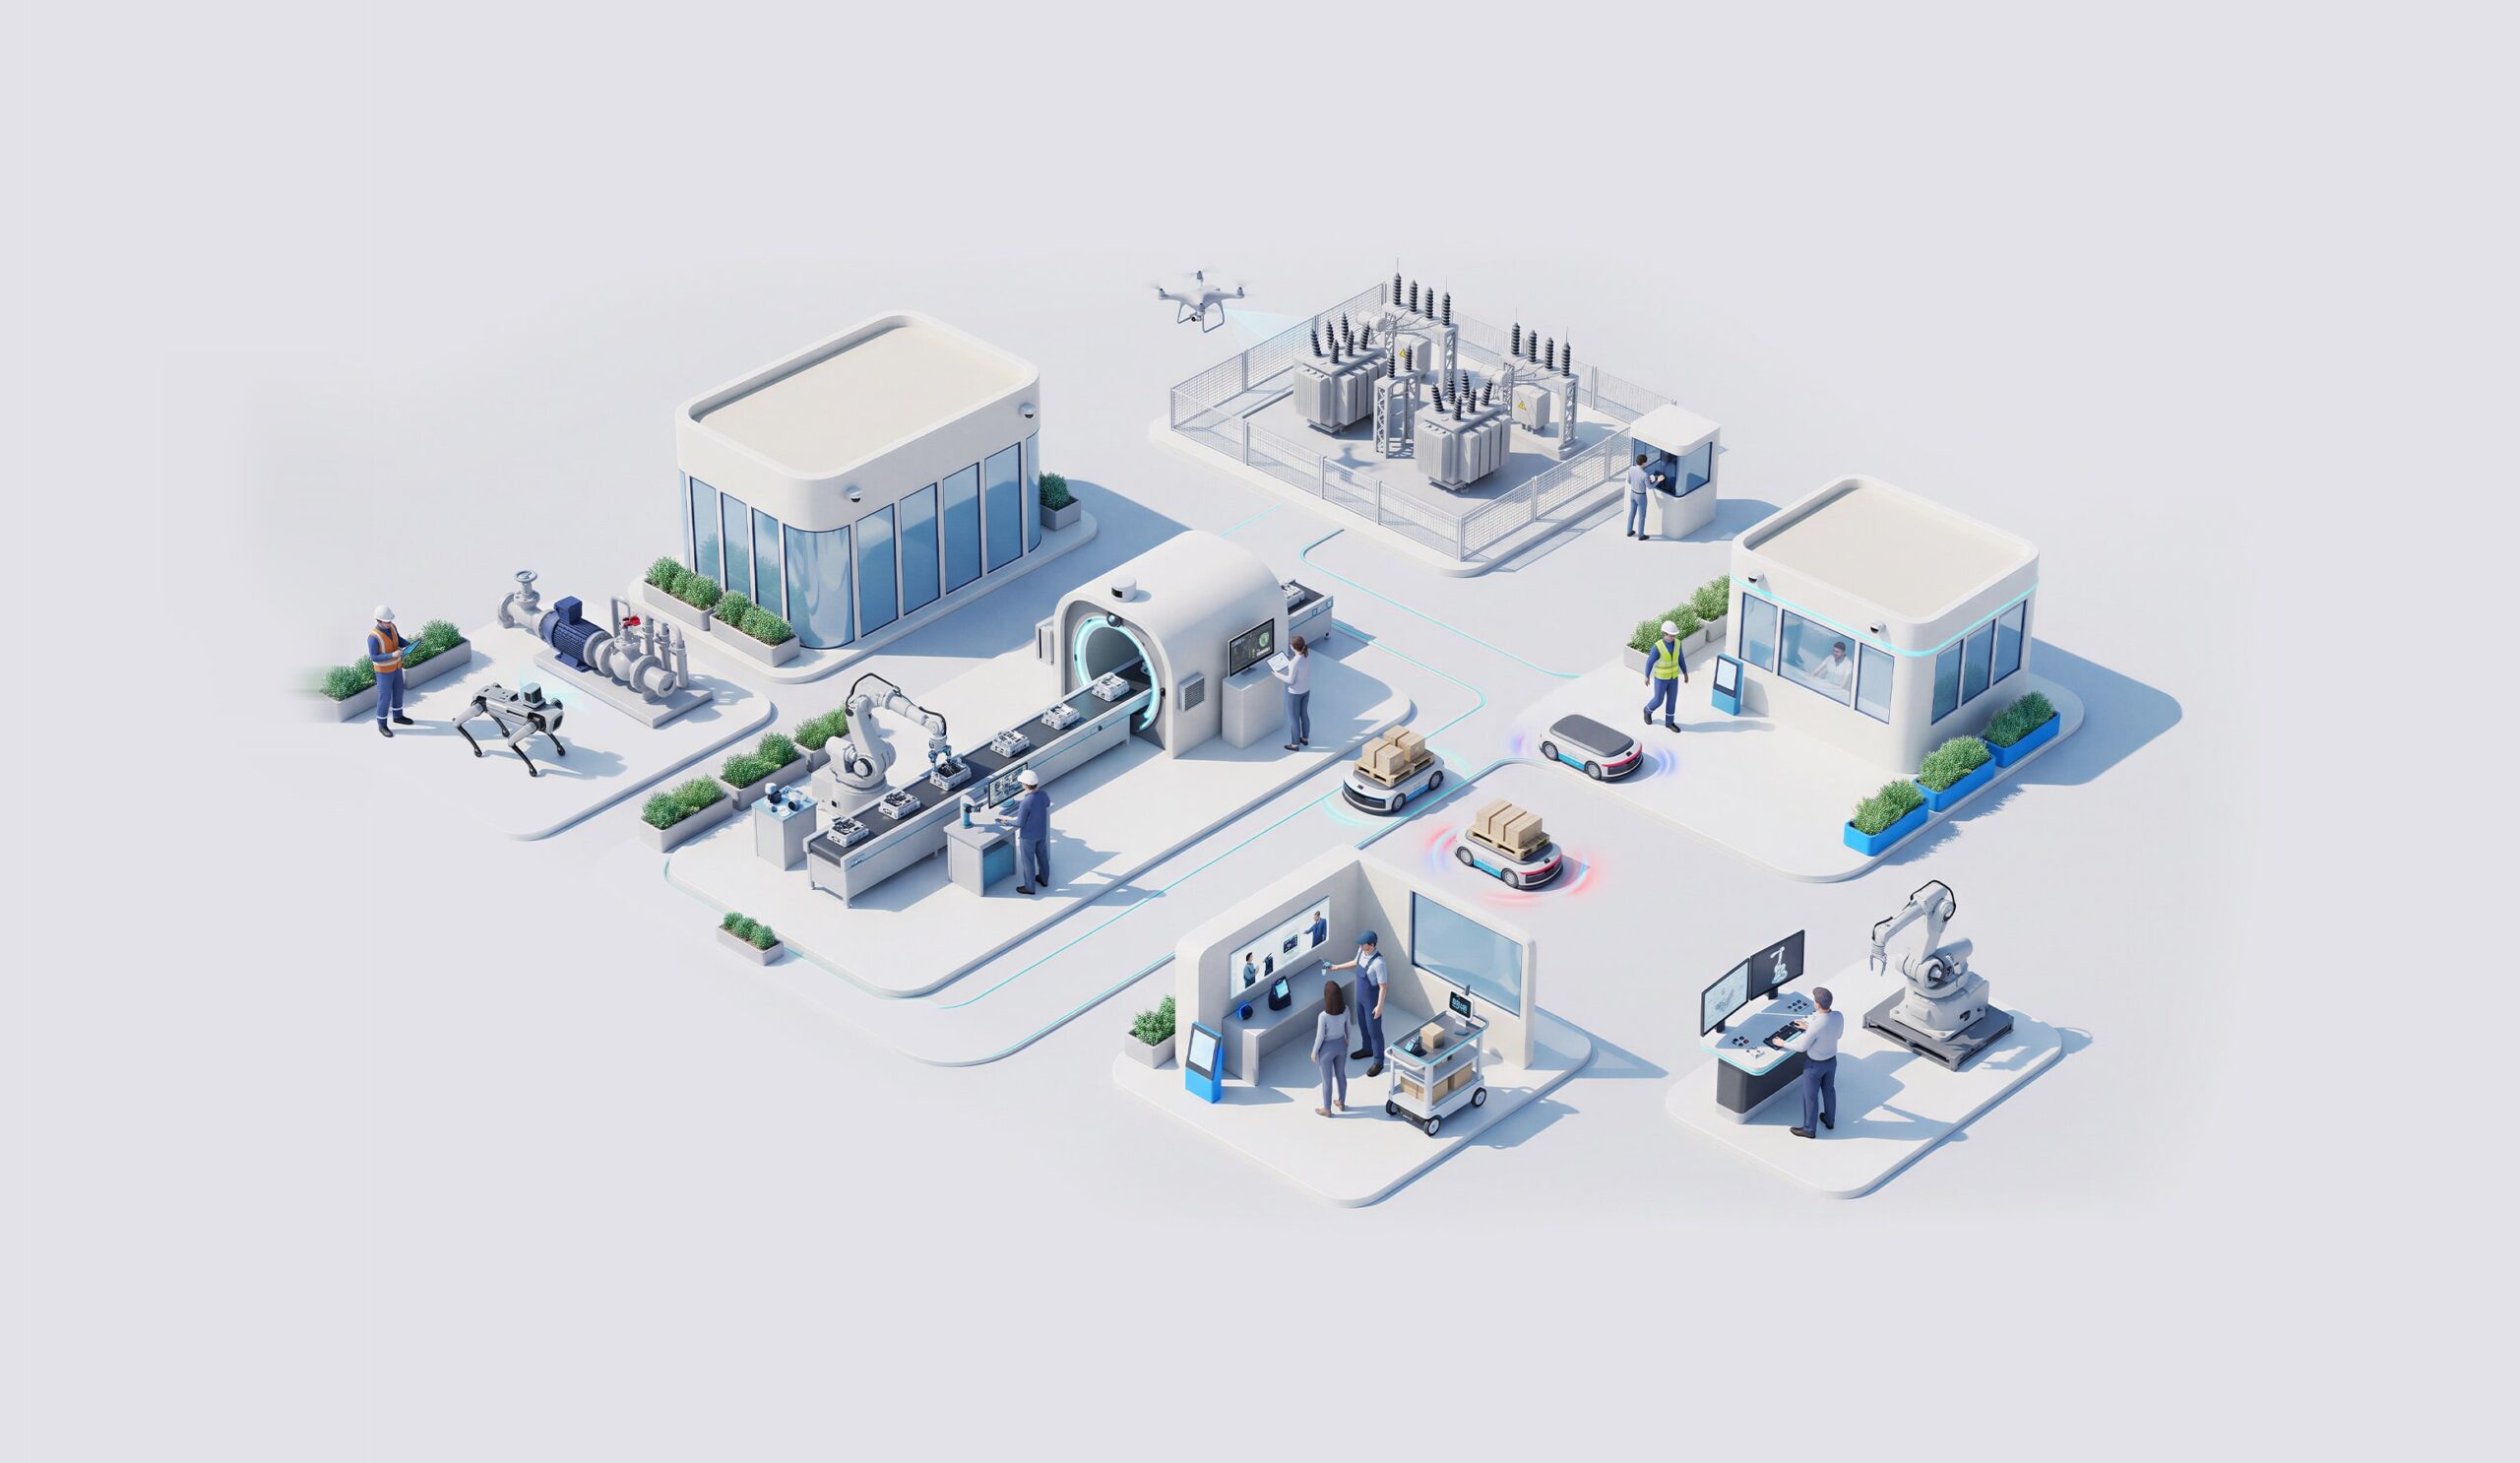
Physical AI
Physical AI gives machines, robots and physical operations the ability to perceive their environment, decide what matters and act in real time. Factories, plants, stores and infrastructure become systems able to sense conditions, learn from them and improve on their own, closing the gap between the physical and the digital world.
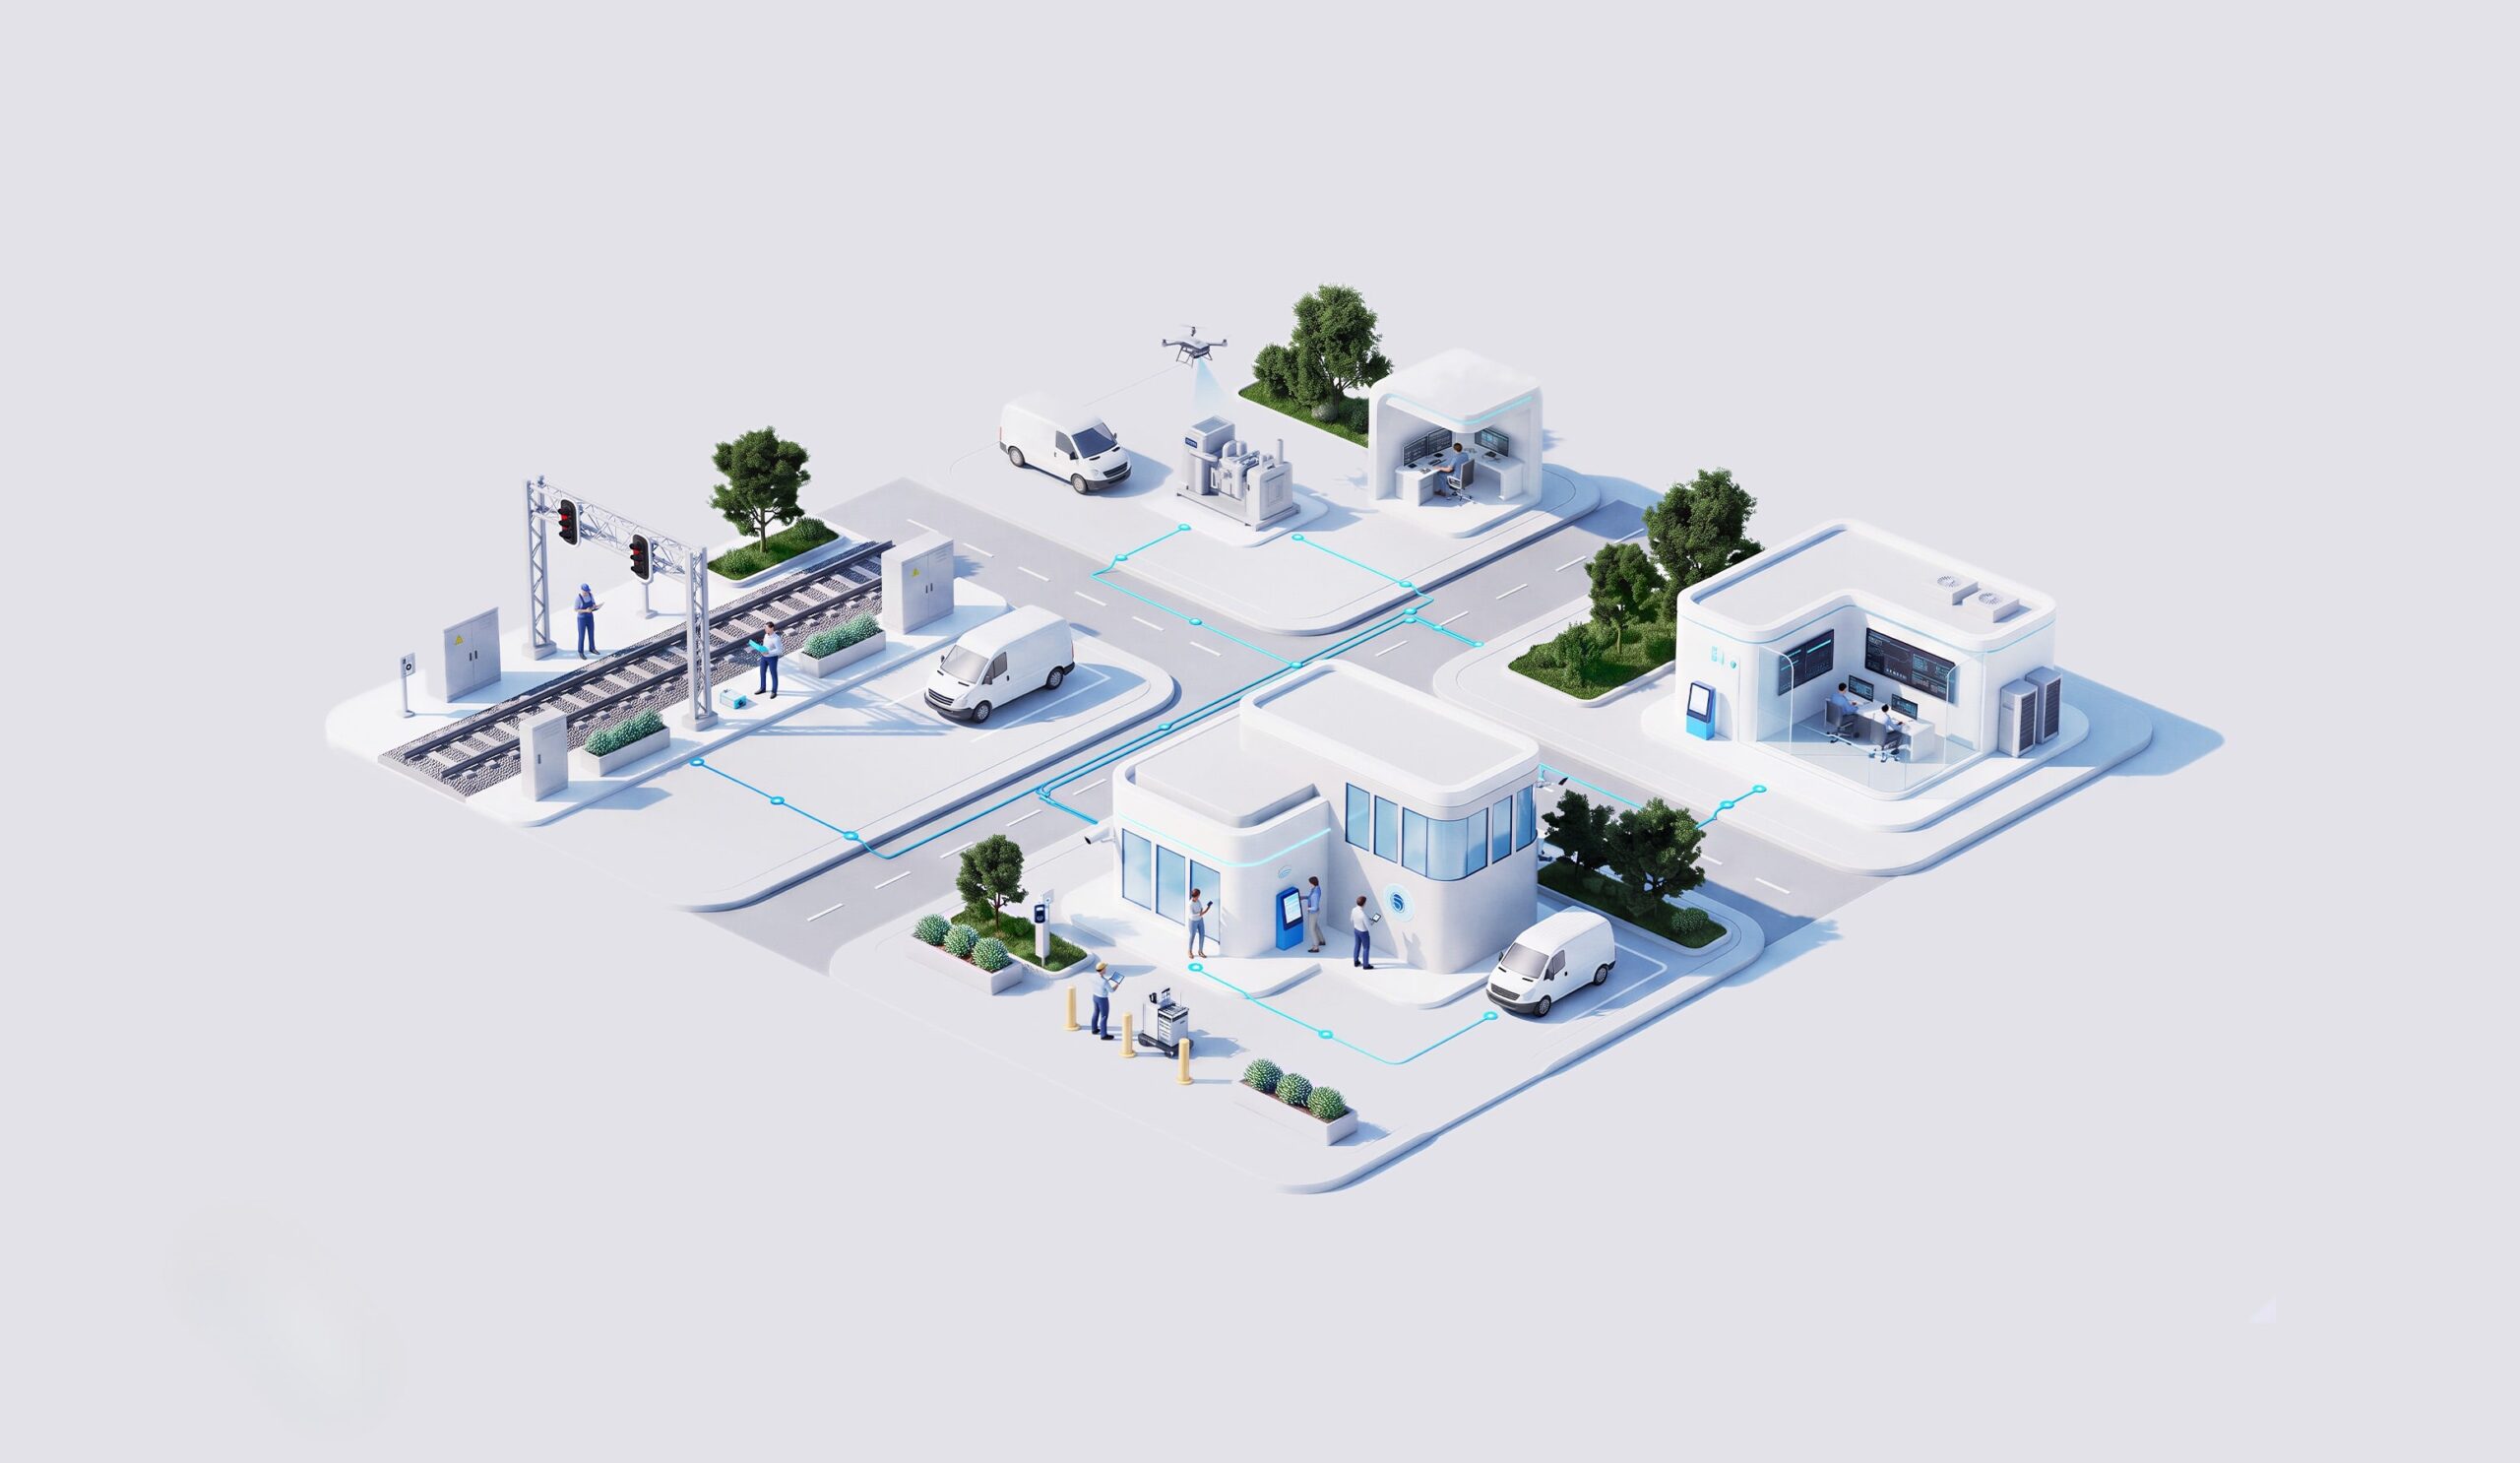
Next-Gen Infrastructure
From networks as infrastructure to connected platforms that enable critical, autonomous and intelligent operations.



Business Talk
Real-Time Forecourt Monitoring
Enabling instant visibility into assets, incidents, and performance
Schedule a meeting
Listen podcast
-15
+15
0:00
/0:00
Lack of real-time visibility across forecourt assets and incidents delays response and impacts safety and revenue.
Why real-time forecourt monitoring?
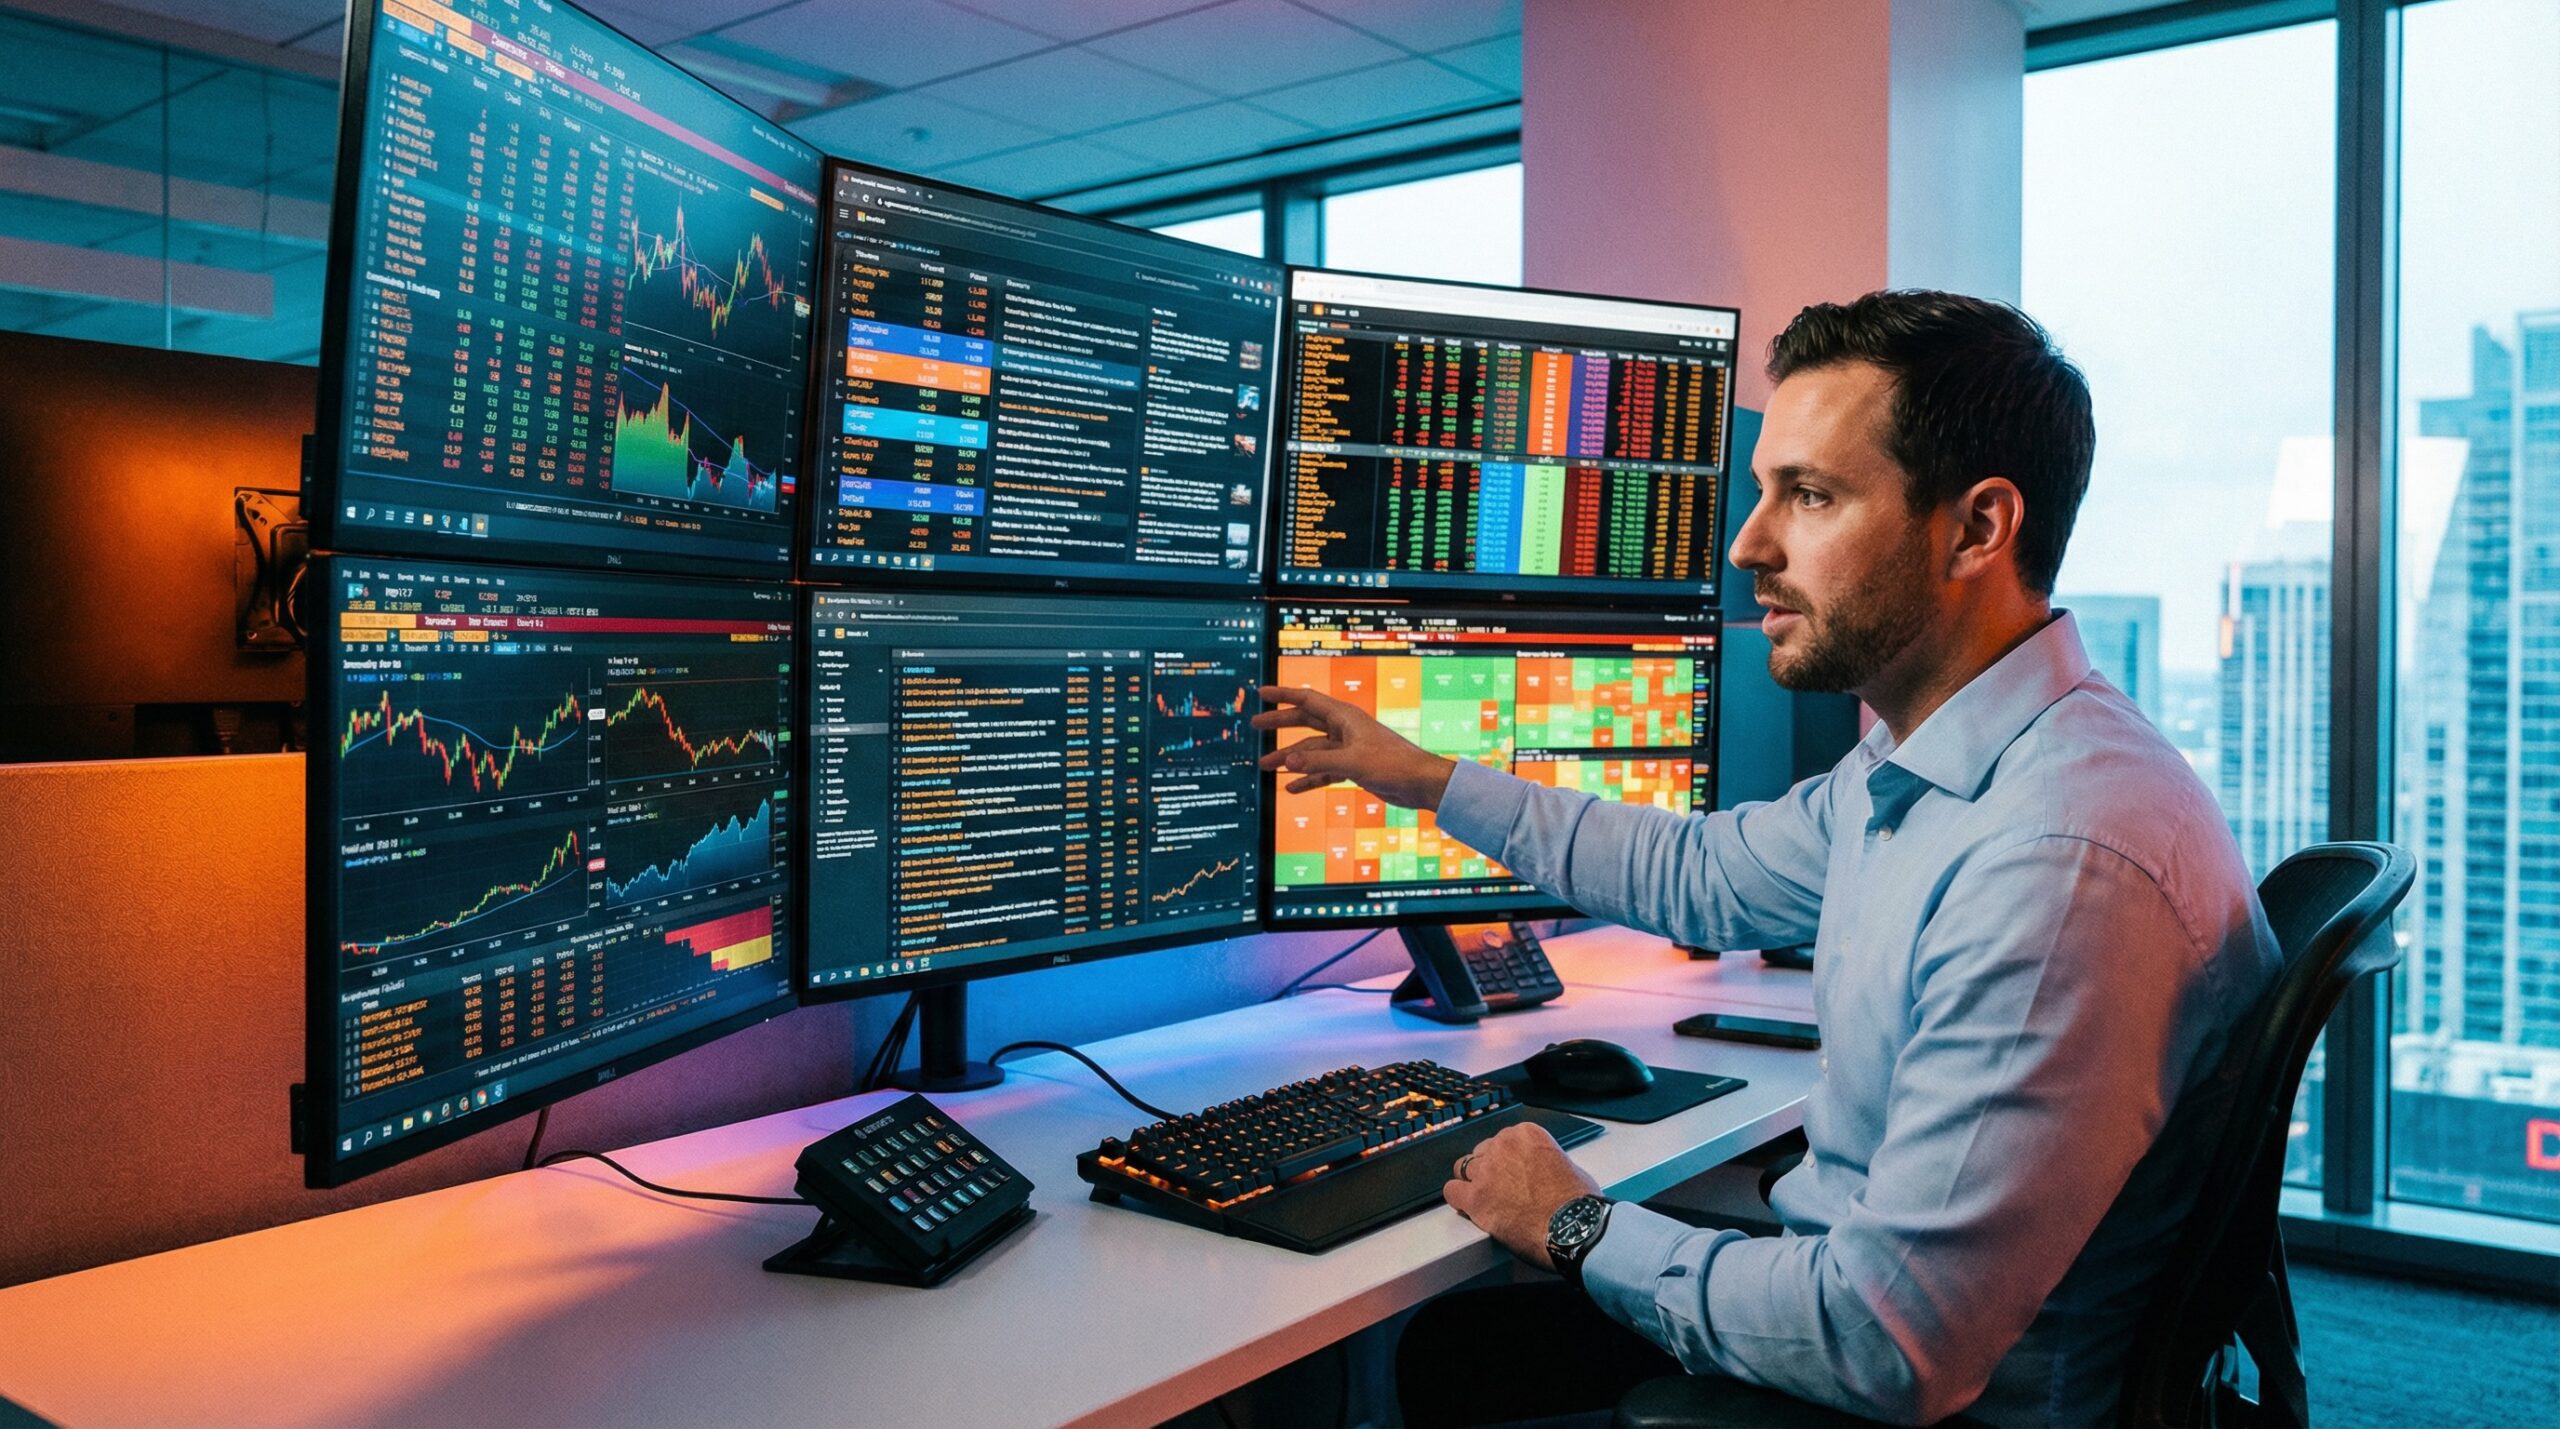
Provides real-time information to establish short-term strategies based on customer behavior. Accelerates decision making and analysis of decision results.
This shifts operations from reactive incident handling to proactive, controlled forecourt performance.
Key benefits

Real-time approach
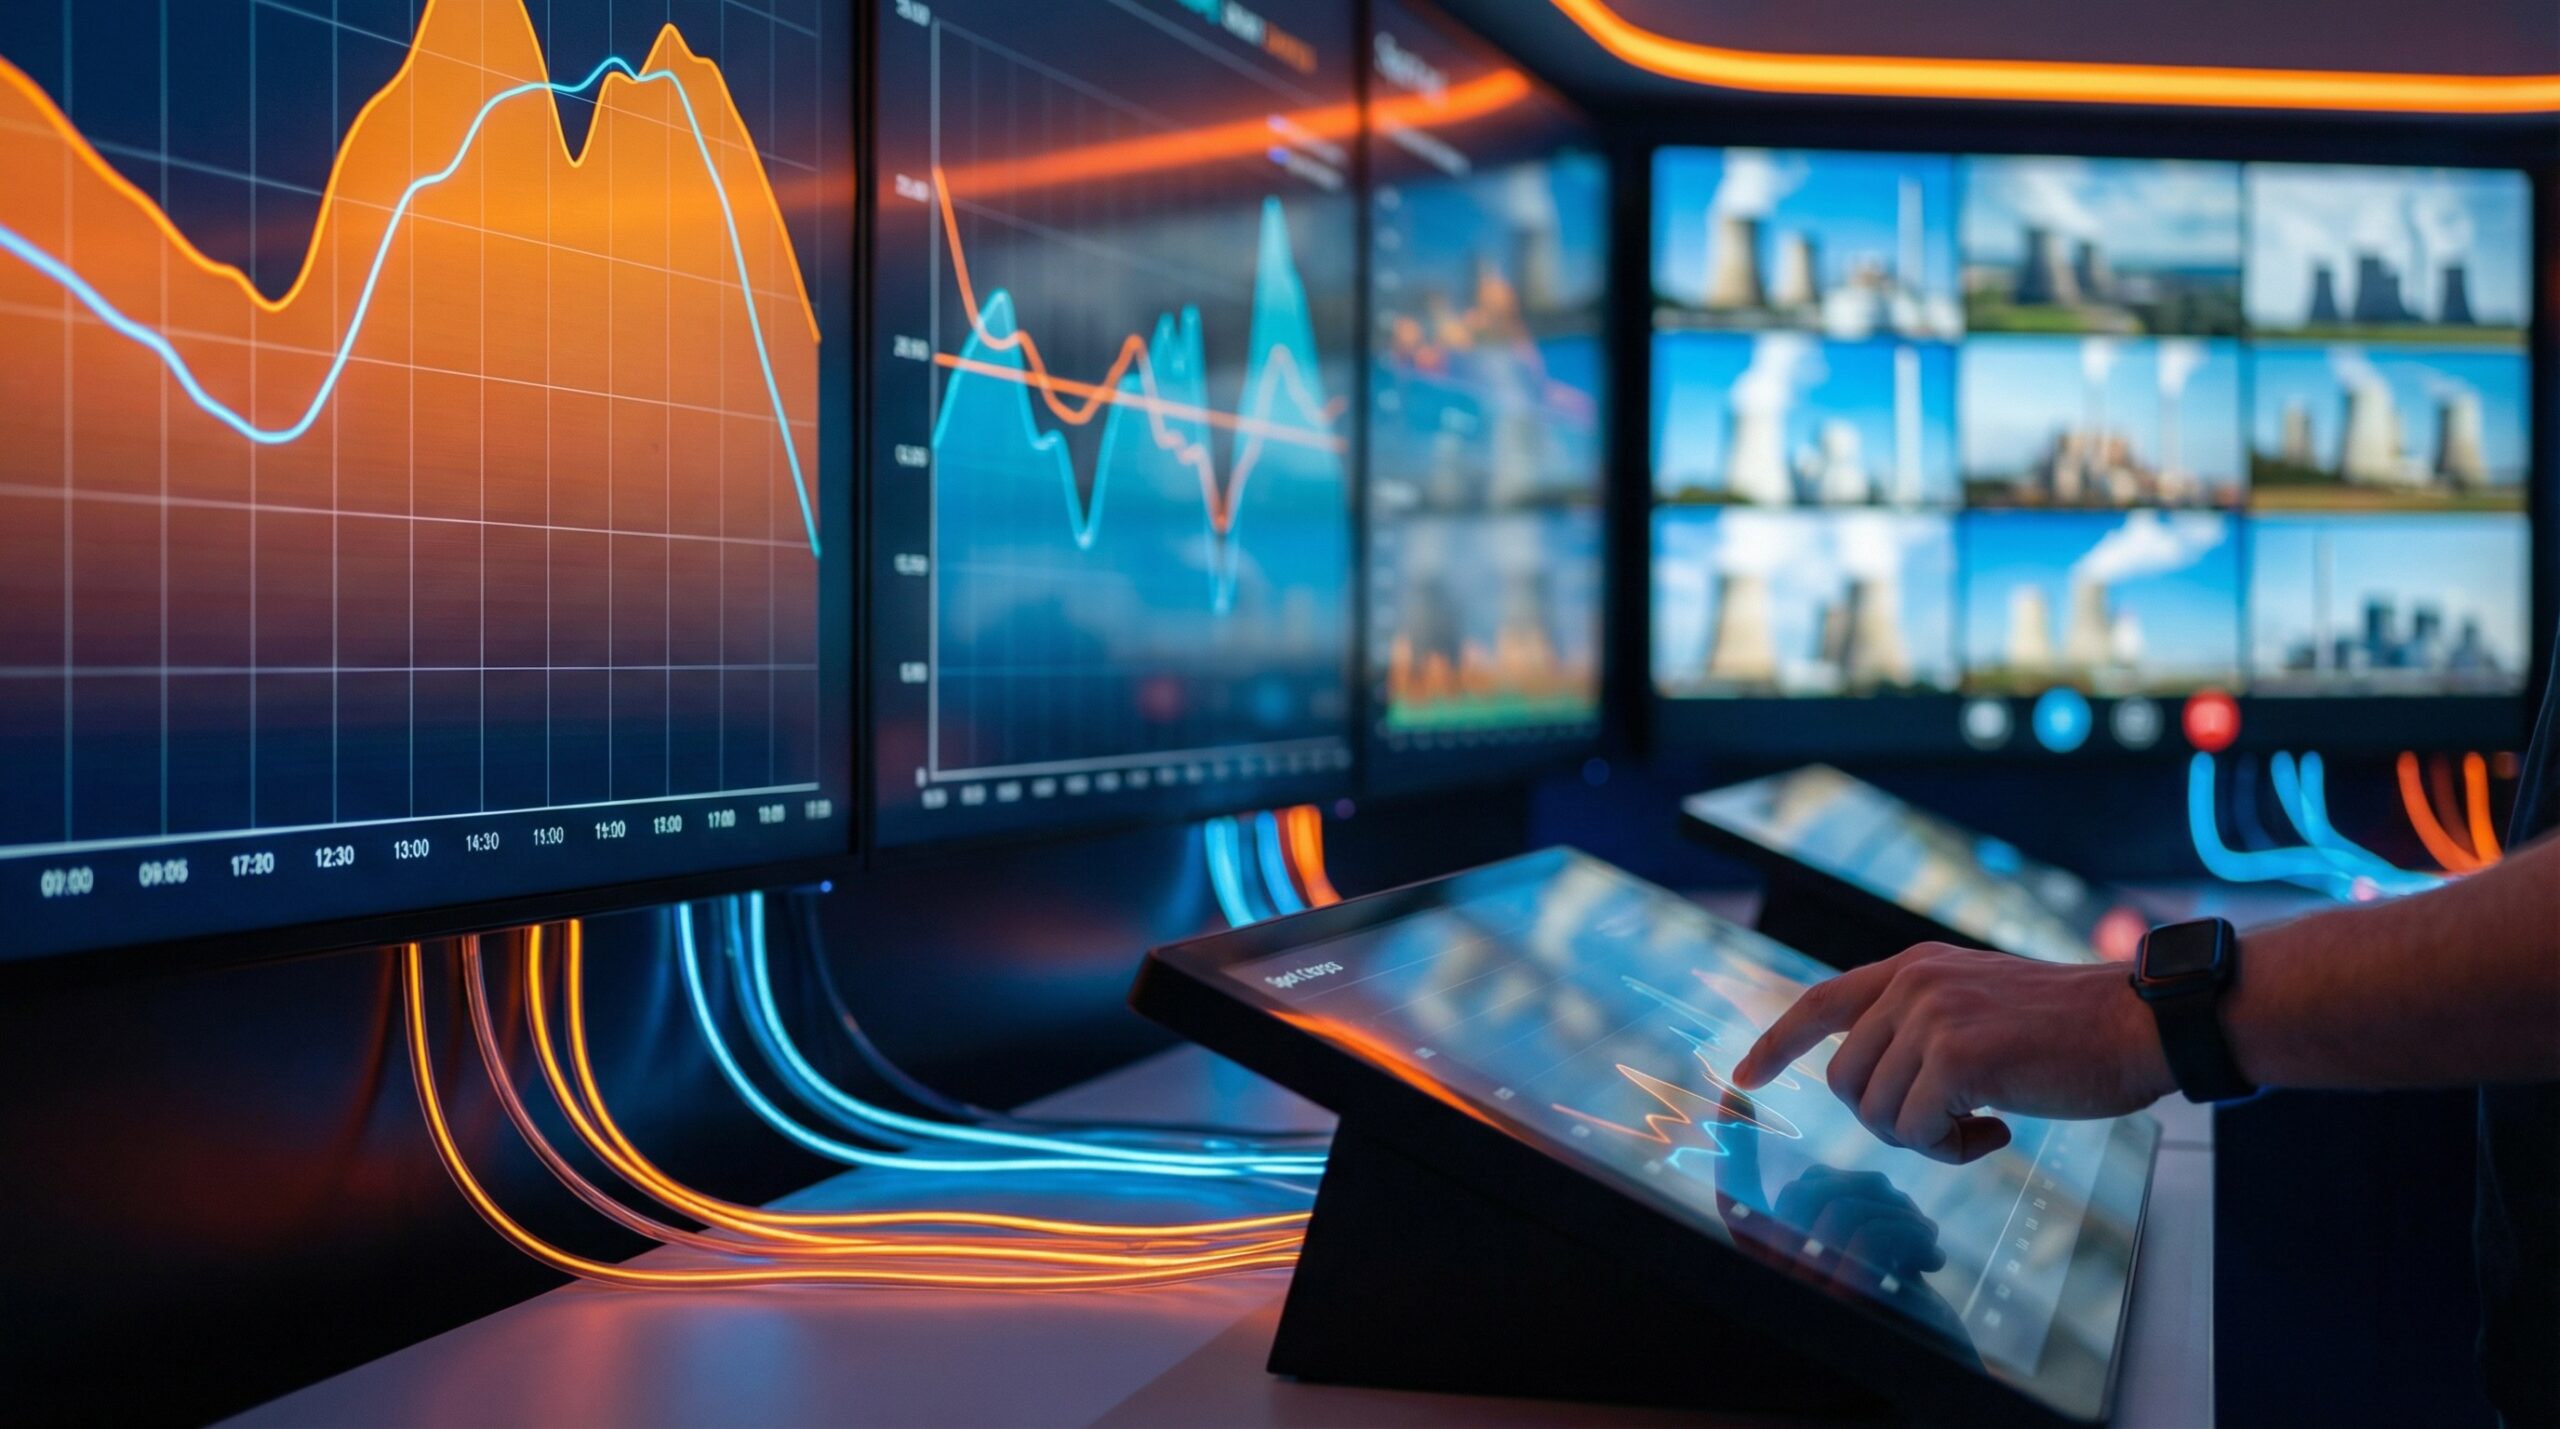
Tool to capture events from service stations (POS & ERP) and show them in real-time (dashboards)
Massive information
Designed to handle large amounts of data and messages and generate tracking metrics.
Real-time alerts
Creation of real-time alerts to warn of irregular situations, thereby improving response times.
Integrable
Designed to be able to integrate with other solutions without affecting the main business flows.
How NTT DATA helps
01
Real-time forecourt monitoring architectures and operating models

02
Predictive analytics

03
Business & Operational dashboards
04
Integration with multiple data sources

Proven impact
Operational visibility achieved
Results that matter
Organizations with real-time forecourt monitoring achieve measurable improvements
Asset uptime
Increased
Incident resolution
Faster
Maintenance efficiency
Improved
Gain instant visibility into forecourt assets and performance
Control forecourt operations