- All Foundries

- Commodity Management & Trading

- Customer & Marketing Strategy

- Digital Engineering

- Station Studio

- Supply Chain & Industry 5.0
- Sustainability

- Physical AI

- Next-Gen Infrastructure













The Autonomous Control Center
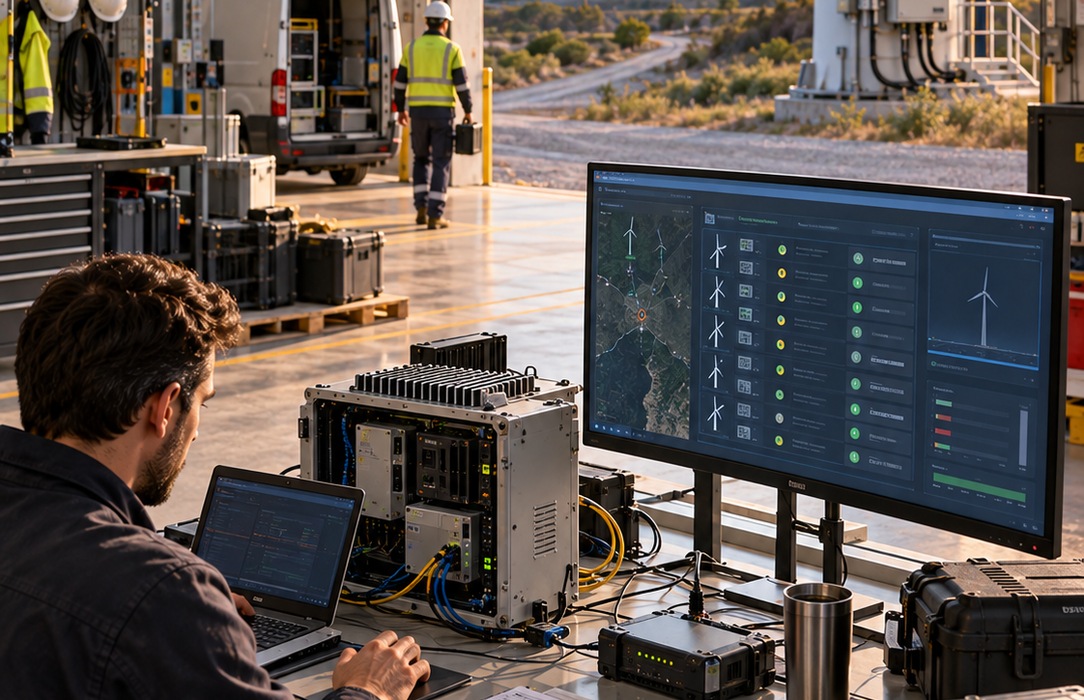
Utilities operate large portfolios of physical assets across complex and sometimes hazardous environments. Yet operational, asset, market and enterprise information often remains fragmented across systems and teams. The real challenge is to connect those signals at the point where a decision is made, then act with the speed the situation requires.

Contextual analytics can connect physical and market conditions with asset and process data, helping teams detect anomalies earlier.
Intelligence embedded in existing workflows can shorten the path from signal to operational action.
Progressive automation can support asset availability and more consistent decisions while retaining human oversight where risk requires it.
A common approach can extend across generation and renewables, transmission and distribution, gas and water infrastructure, and enterprise utility operations.
How NTT DATA helps
Prioritises the operational decisions where autonomy can improve reliability, safety, productivity, resilience or customer value across G&R / T&D.
Brings together authorised utility data, asset information, operational workflows and existing enterprise and OT systems around the process being improved.

Applies Physical AI, Computer Vision, Robotics, IoT, Edge AI and Digital Twins where they can support the relevant asset, workflow or frontline decision.

Defines permissions, cyber controls, validation and fallback mechanisms, and keeps human oversight wherever safety, regulatory or operational risk demands it.

Starts with controlled use cases, establishes operational KPIs and creates an interoperable path to scale across sites, asset classes and business units without locking critical operations into a single technology path.


The source defines indicative improvement objectives for a controlled deployment. It does not provide verified results from a named implementation, so these figures should be treated as targets to baseline and validate, not as proven outcomes.
Target reduction of 20–40%.
Target reduction of 20–40%.
Target reduction of 15–30%.
Significant improvement, with the measurement method still to be defined.
Start the conversation that connects assets, intelligence and human judgment around the decisions that matter most.