


- All Foundries

- 商品管理と取引

- 顧客とマーケティング戦略

- デジタルエンジニアリング

- ステーション・スタジオ

- サプライチェーン&インダストリー5.0
- サステナビリティ

- Physical AI

- Next-Gen Infrastructure

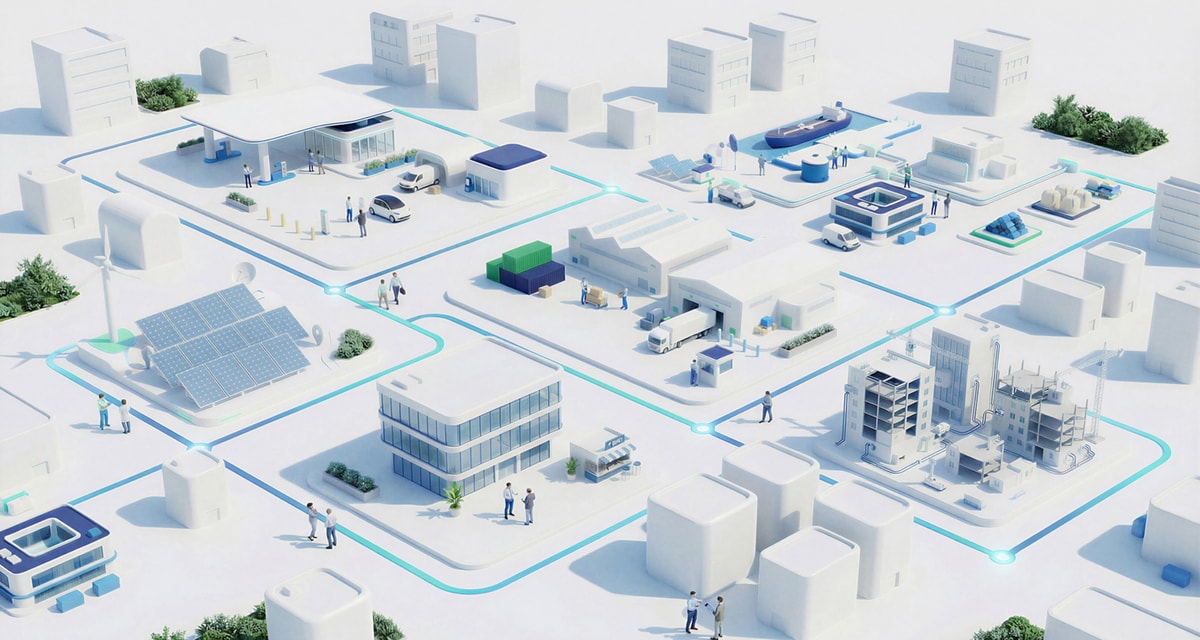

All Foundries
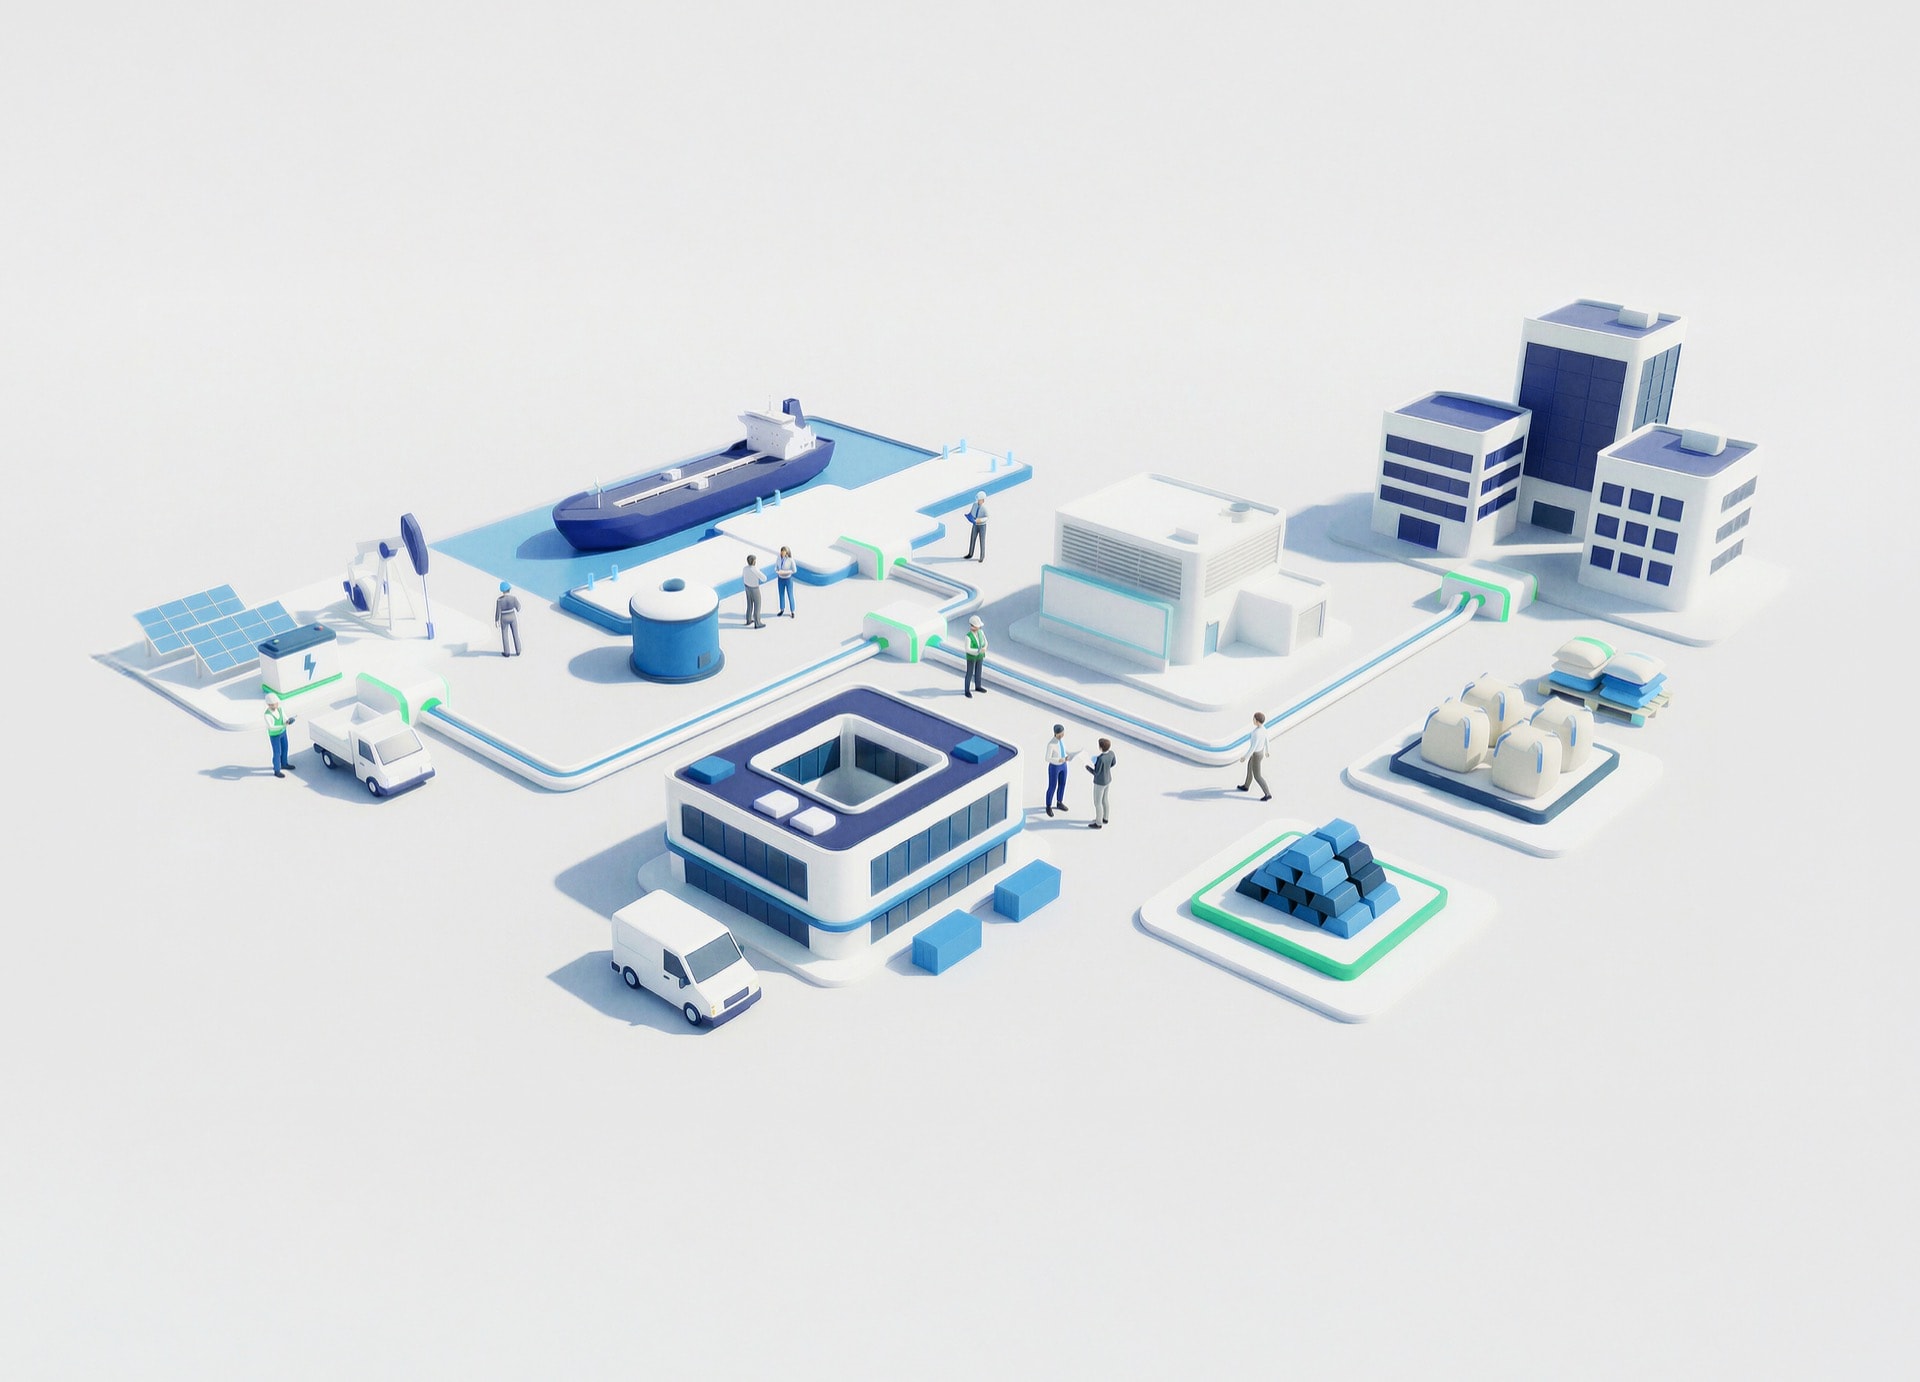
商品管理と取引
データに基づくインサイトと、セキュアで機動性の高いプラットフォームにより、グローバルな商取引を支えるトレーディングエコシステムを変革します。

顧客とマーケティング戦略
パーソナライズされたつながりある体験を通じて顧客エンゲージメントを再構築し、信頼と長期的な価値を築きます。
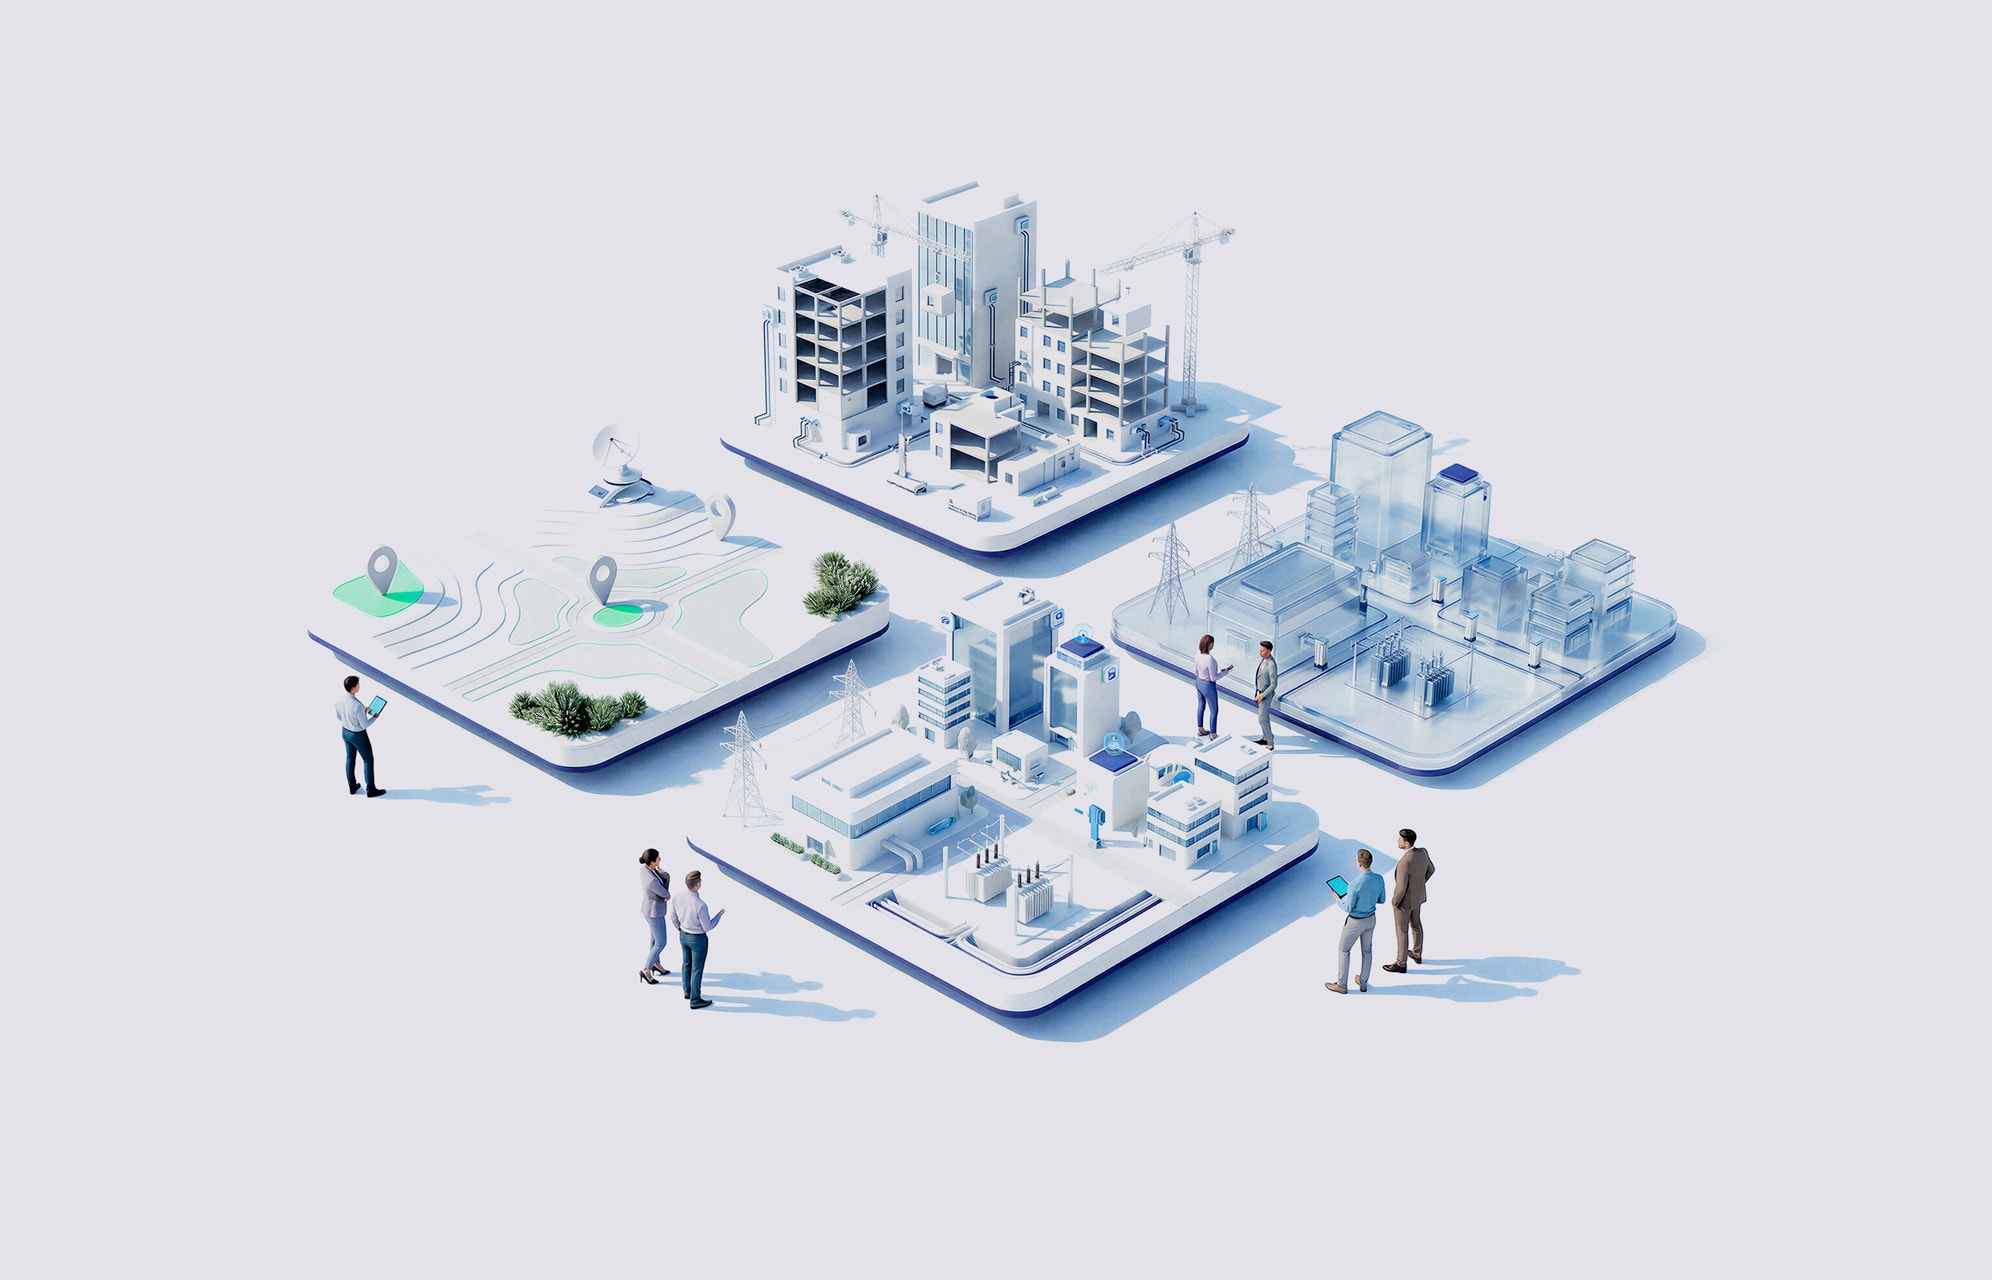
デジタルエンジニアリング
アイデアをスケーラブルなデジタルソリューションへと転換し、デザイン・テクノロジー・エンジニアリングの力で加速させます。
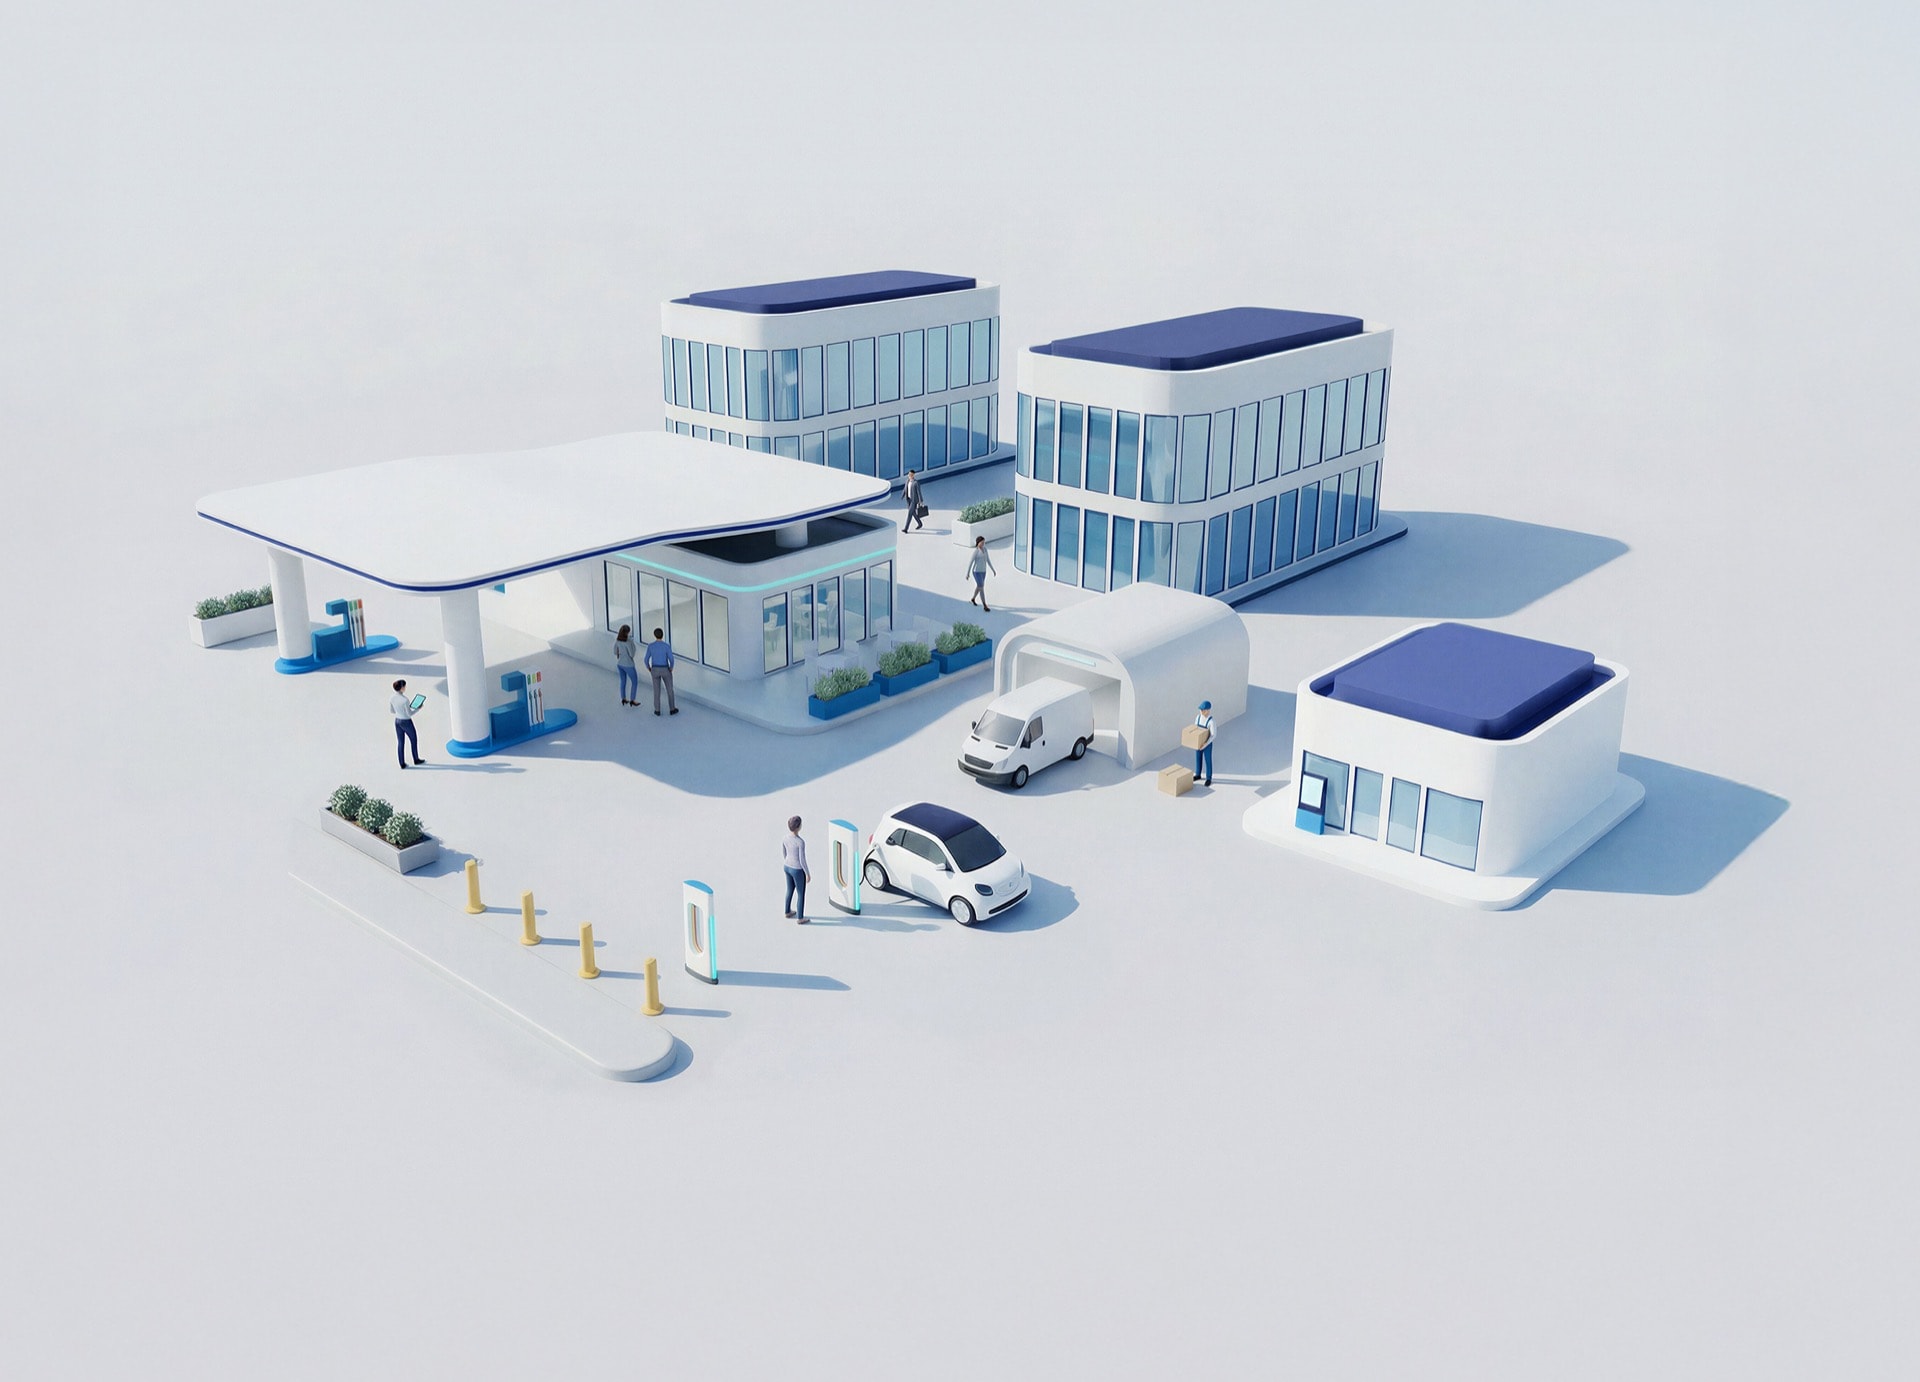
ステーション・スタジオ
デジタルイノベーションでモビリティハブを再定義し、移動中の人々と企業に、よりスマートでサステナブルな体験を創出します。
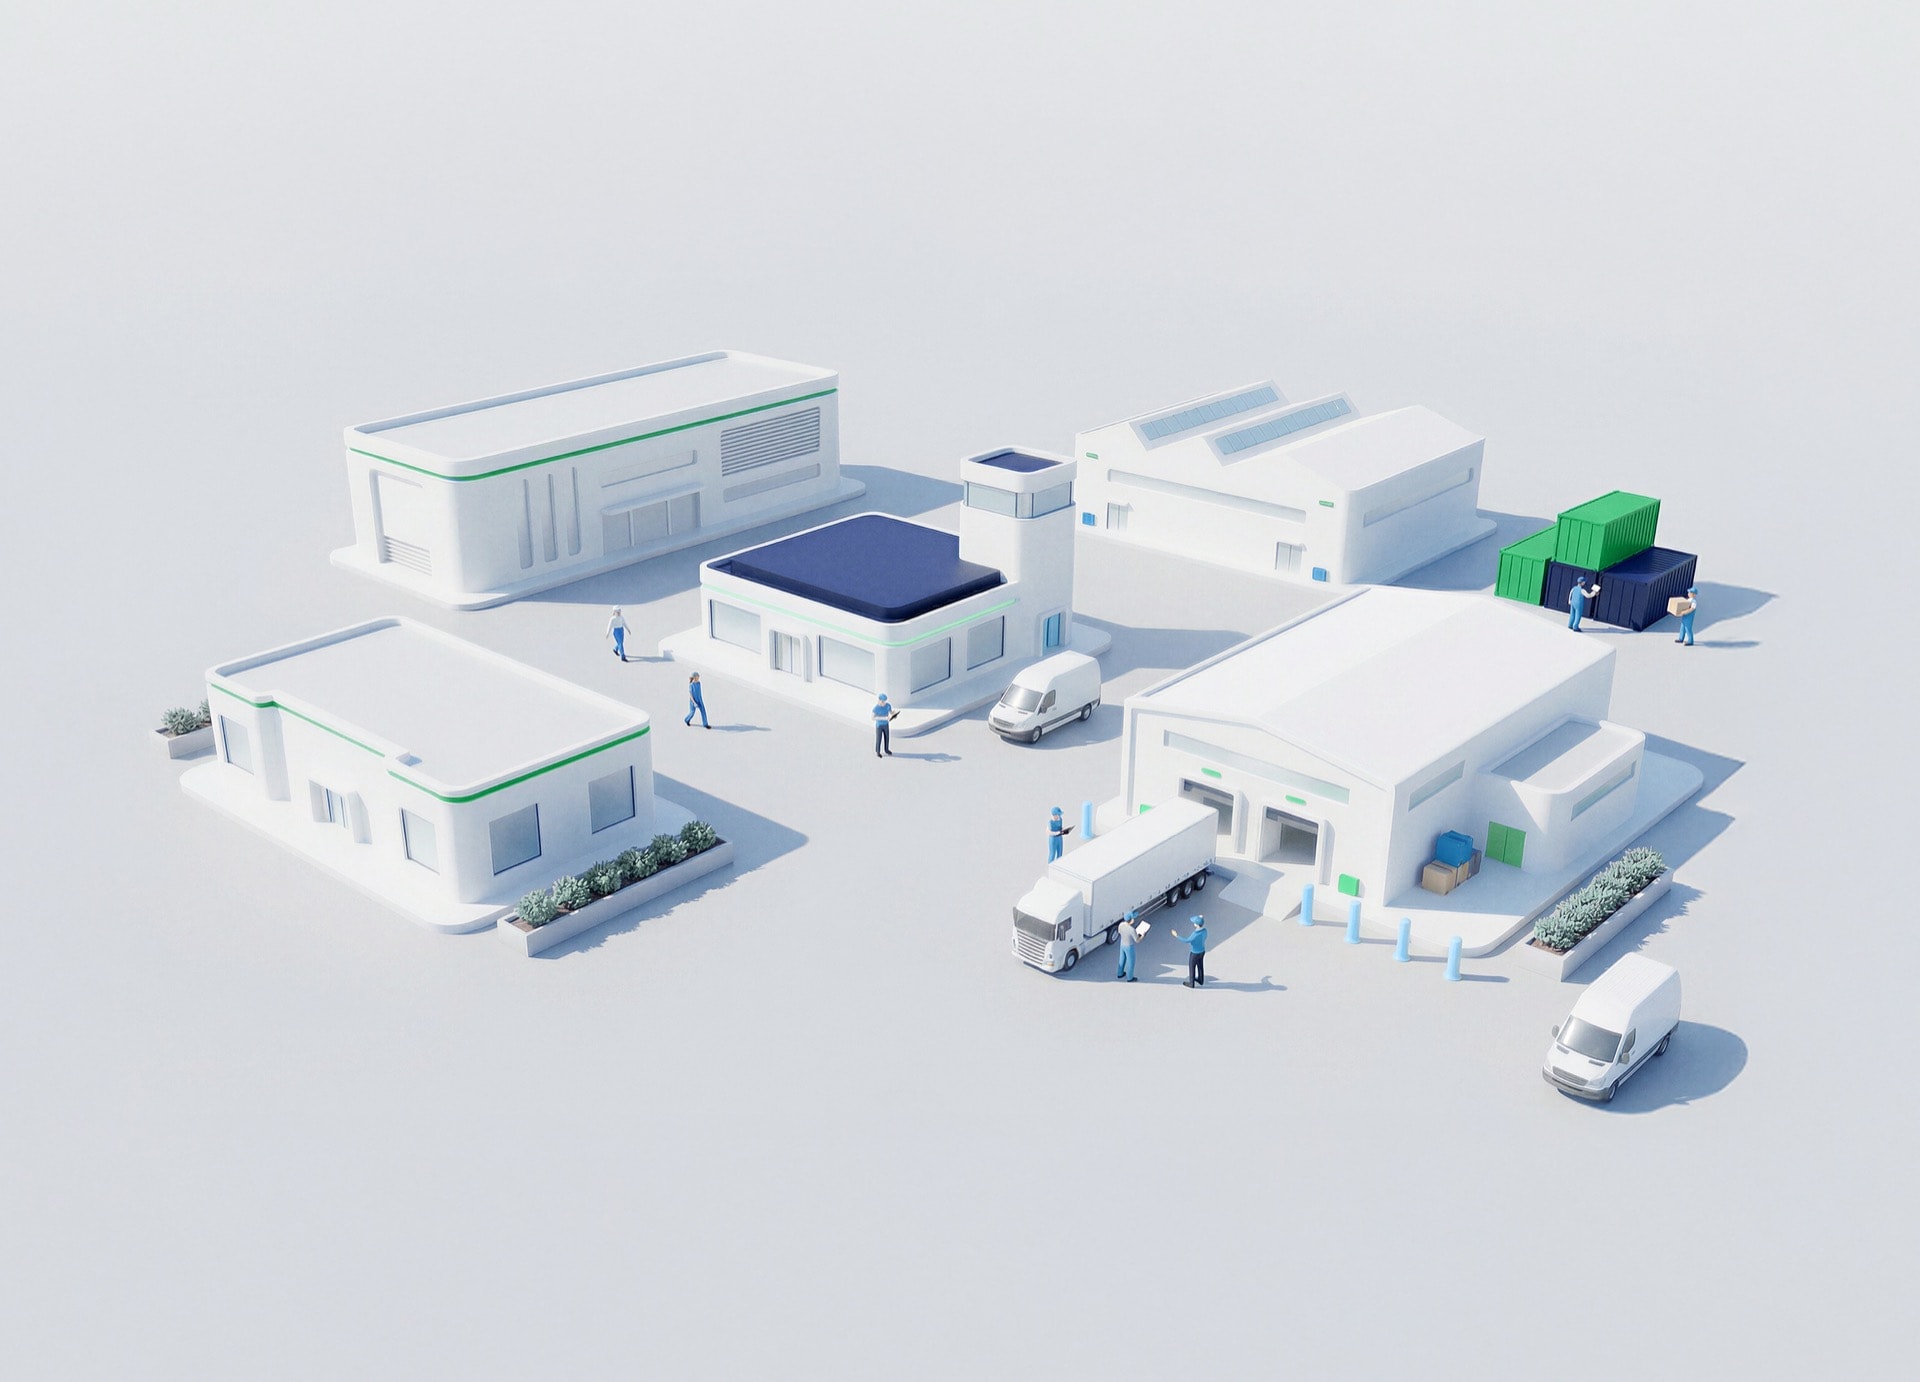
サプライチェーン&インダストリー5.0
変化を予測し、目的を持って効率性を実現する、強靭で知的な供給ネットワークを構築します。
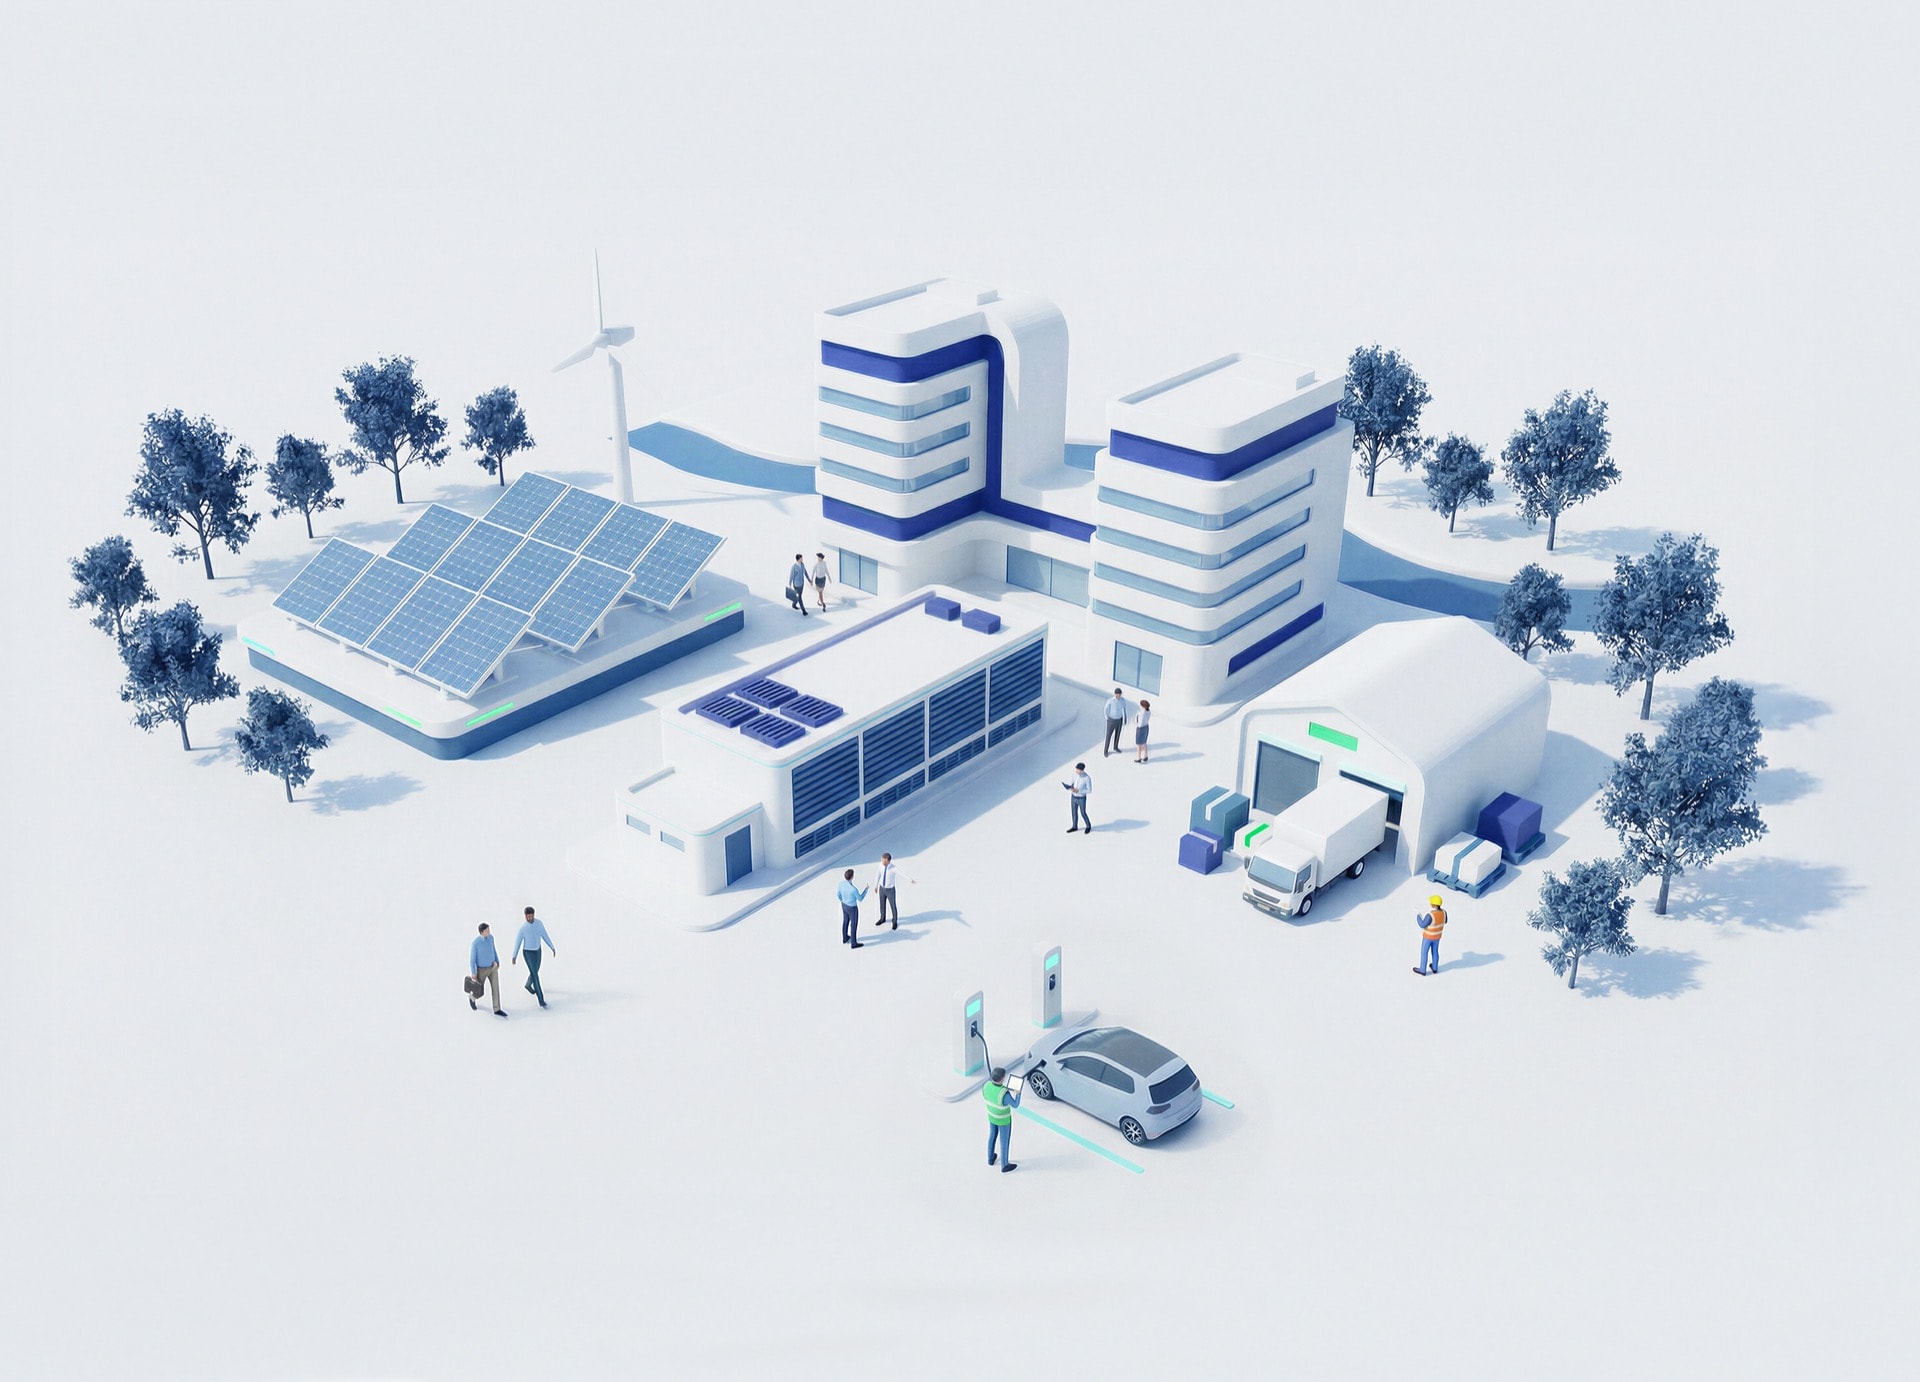
サステナビリティ
責任あるイノベーションを推進し、組織がネットゼロ目標を達成し、将来の世代に良い影響をもたらすよう応援します。
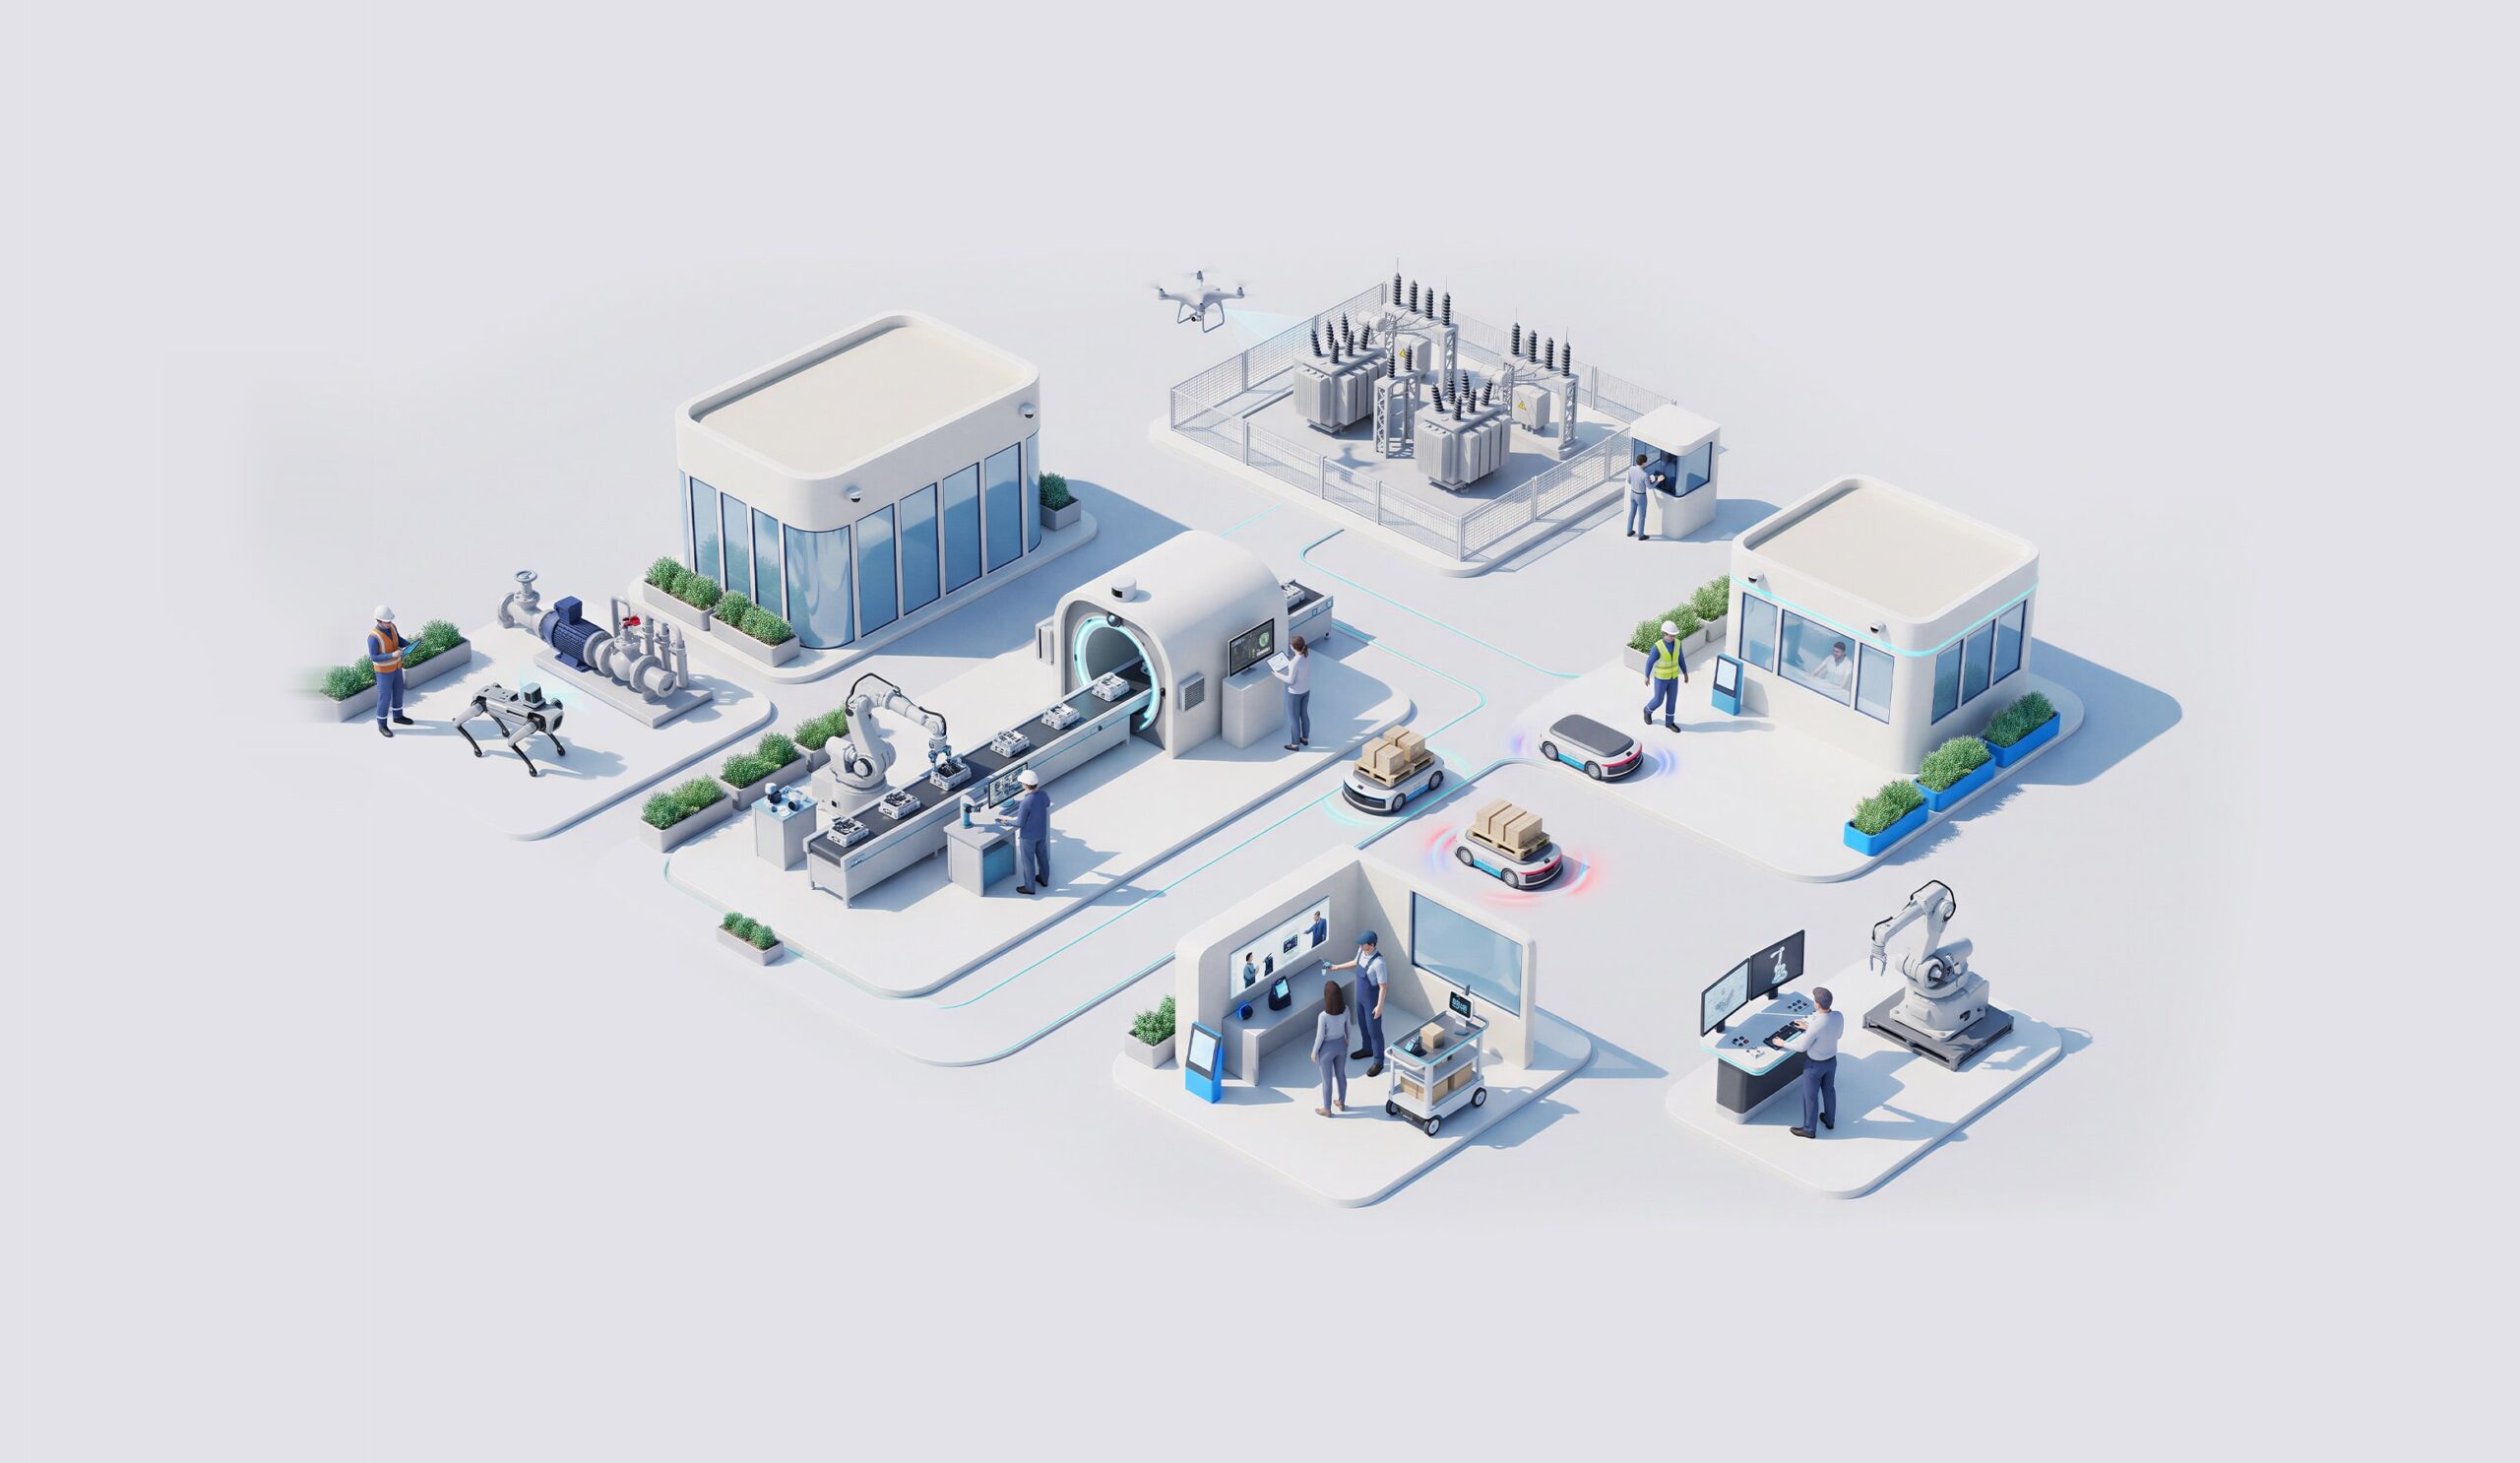
Physical AI
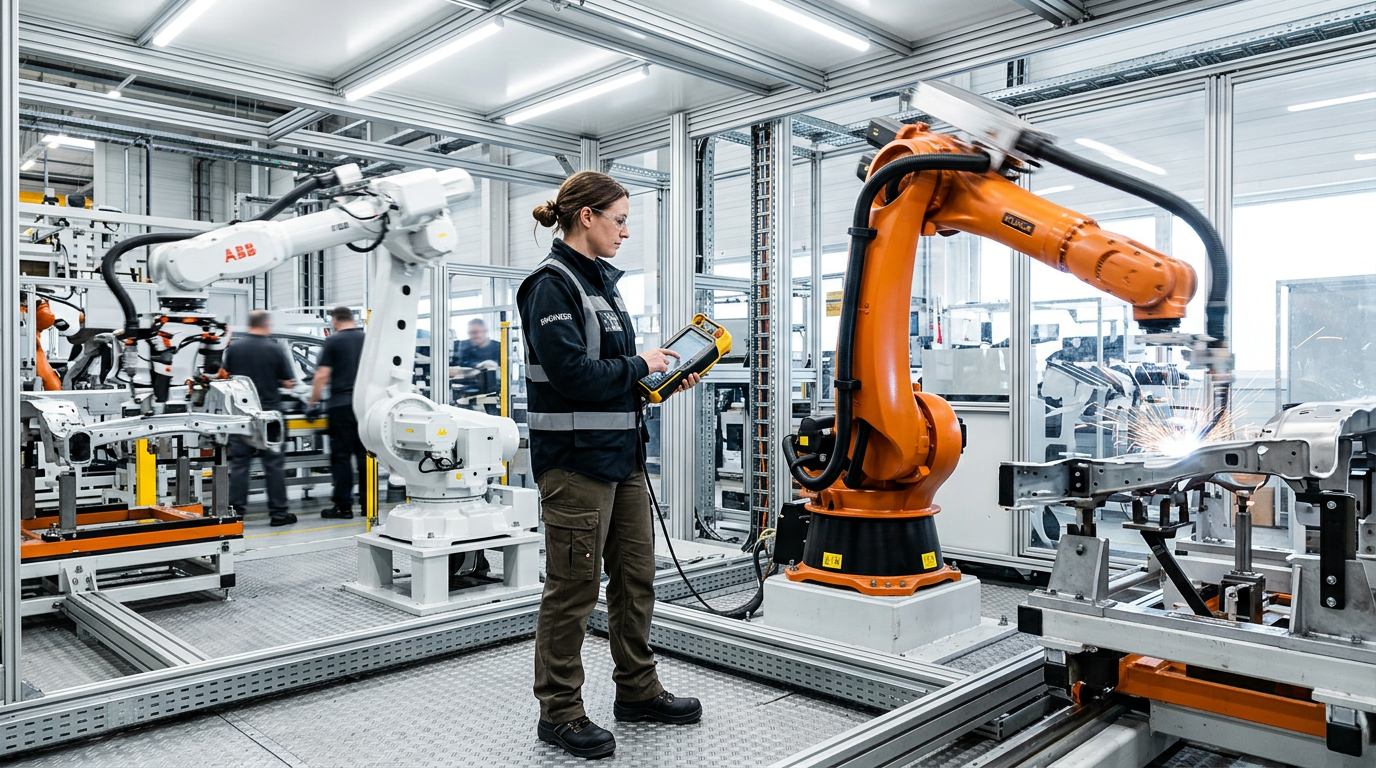
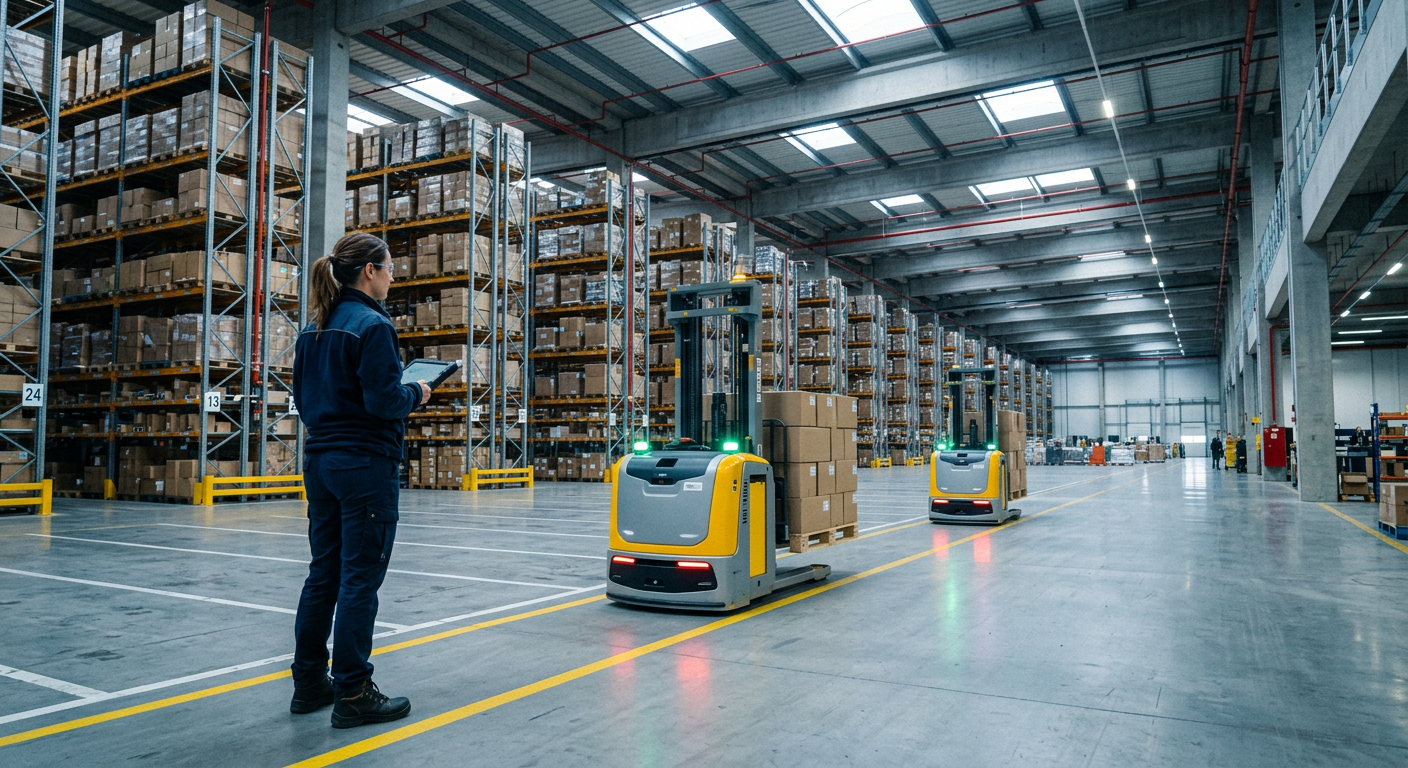
Physical AI gives machines, robots and physical operations the ability to perceive their environment, decide what matters and act in real time. Factories, plants, stores and infrastructure become systems able to sense conditions, learn from them and improve on their own, closing the gap between the physical and the digital world.
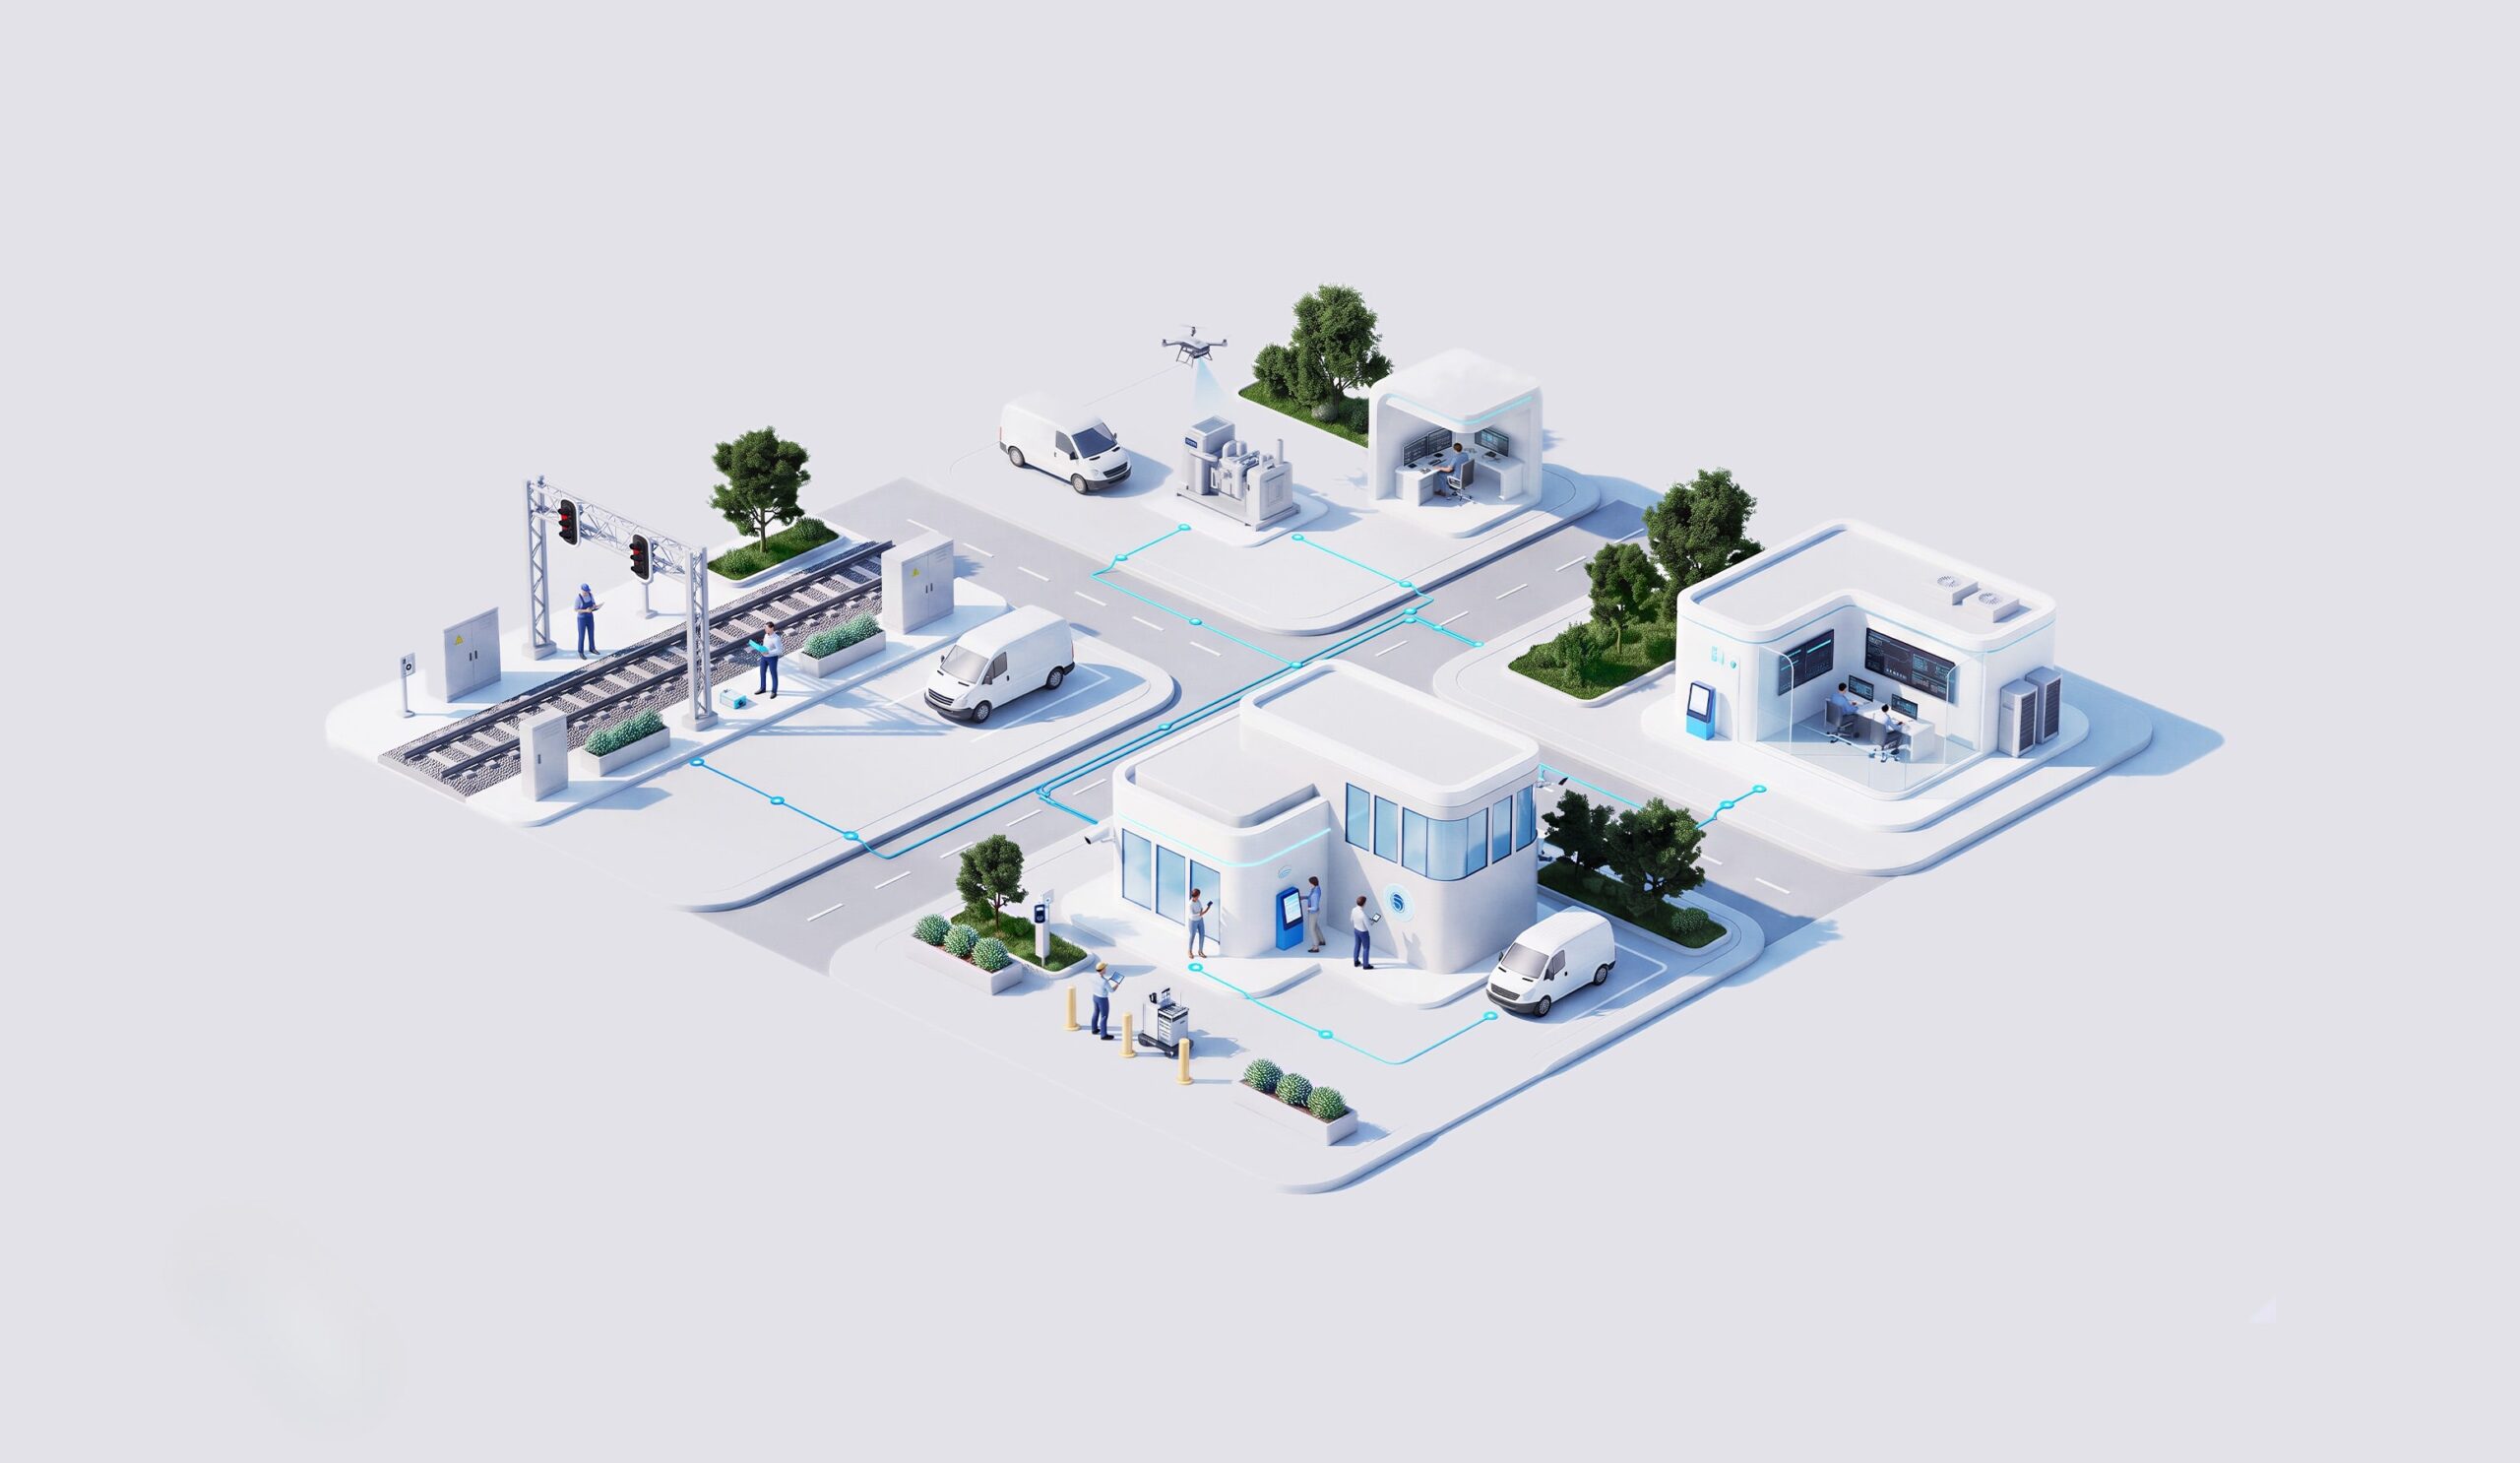
Next-Gen Infrastructure
From networks as infrastructure to connected platforms that enable critical, autonomous and intelligent operations.

ポッドキャストを聴く
-15
+15
0:00
/0:00
断片的な予測は変動性と非効率性を生みます。
なぜ統合需要計画が必要なのか?
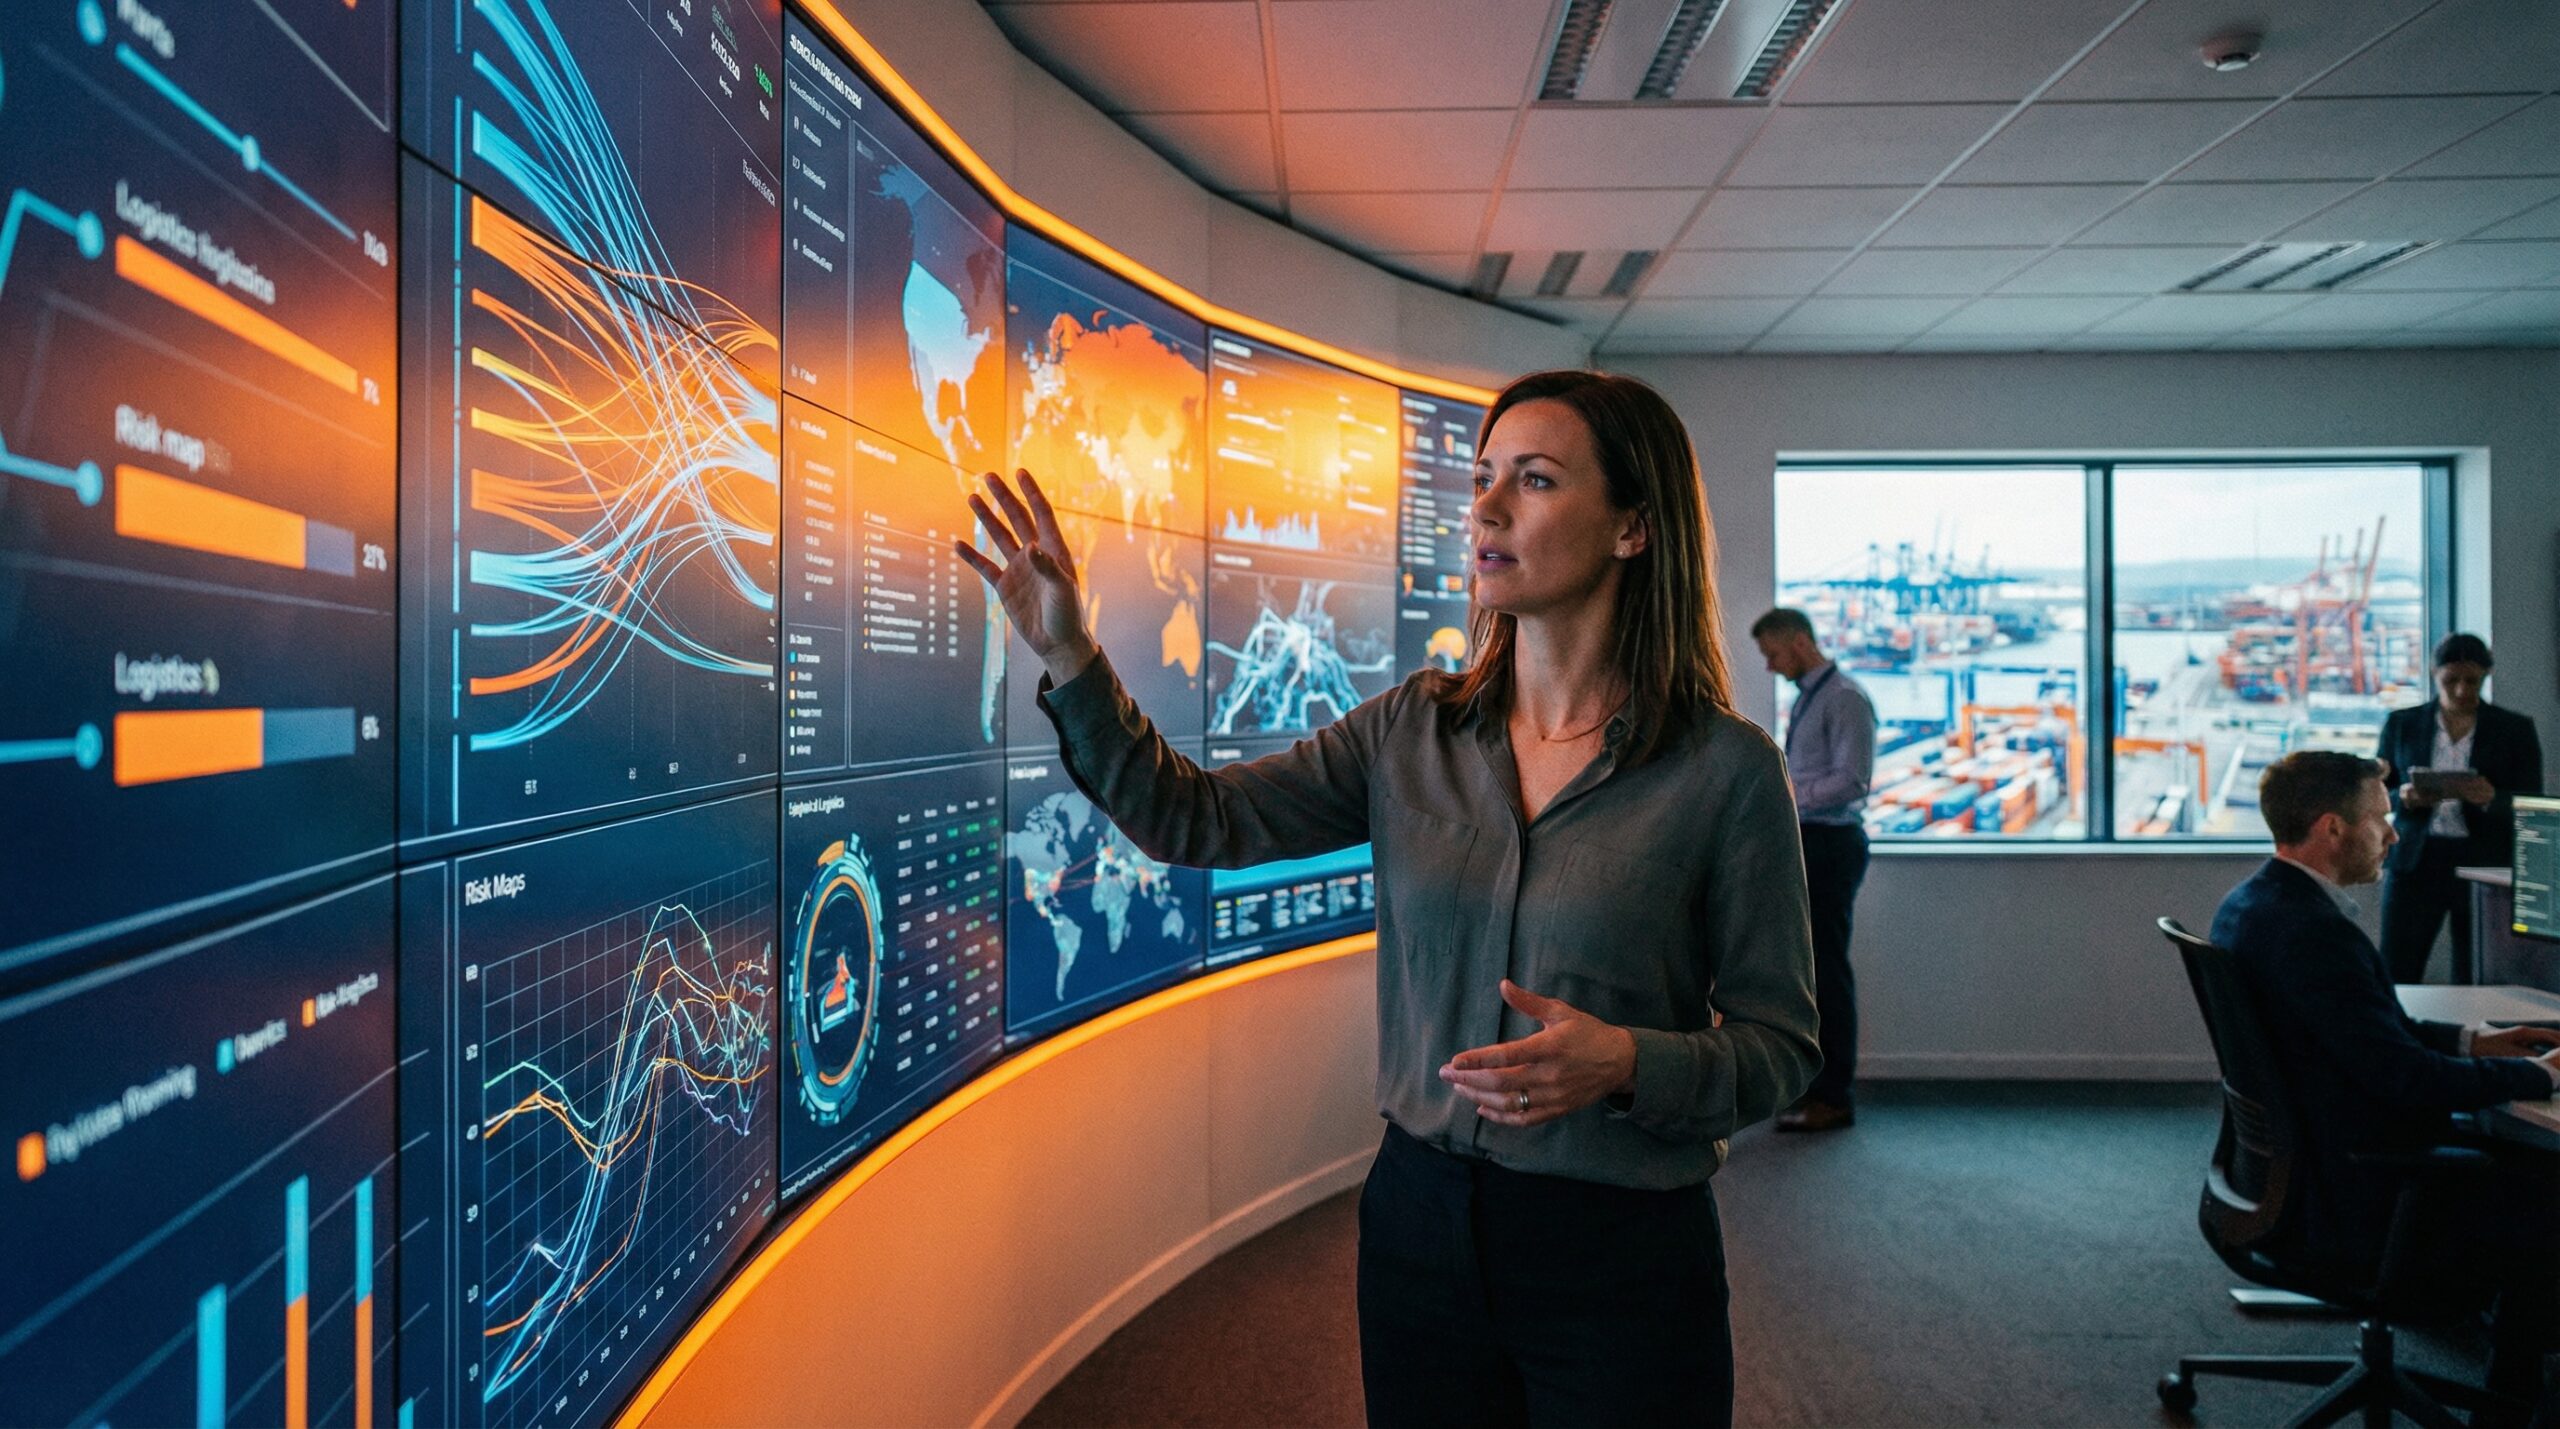
統合需要計画は入力とシナリオを同期化し、対応力を向上させます。
一つの要求信号。
主なメリット

予測精度の向上
より良いサービス水準
在庫削減 水準
部門間の連携強化
NTTデータのサポート体制は?
01
需要計画プラットフォーム

02
シナリオモデリングツール

03
複数期間予測

04
営業とオペレーションとの統合
05
分析とKPI追跡
実証済みの効果
計画精度の向上
重要な結果
サプライチェーン部門は、定量的な改善を実現しています:
予測精度
増加した
サービスレベル
改良された
在庫
バッファの削減
