- All Foundries

- 商品管理と取引

- 顧客とマーケティング戦略

- デジタルエンジニアリング

- ステーション・スタジオ

- サプライチェーン&インダストリー5.0
- サステナビリティ

- Physical AI

- Next-Gen Infrastructure







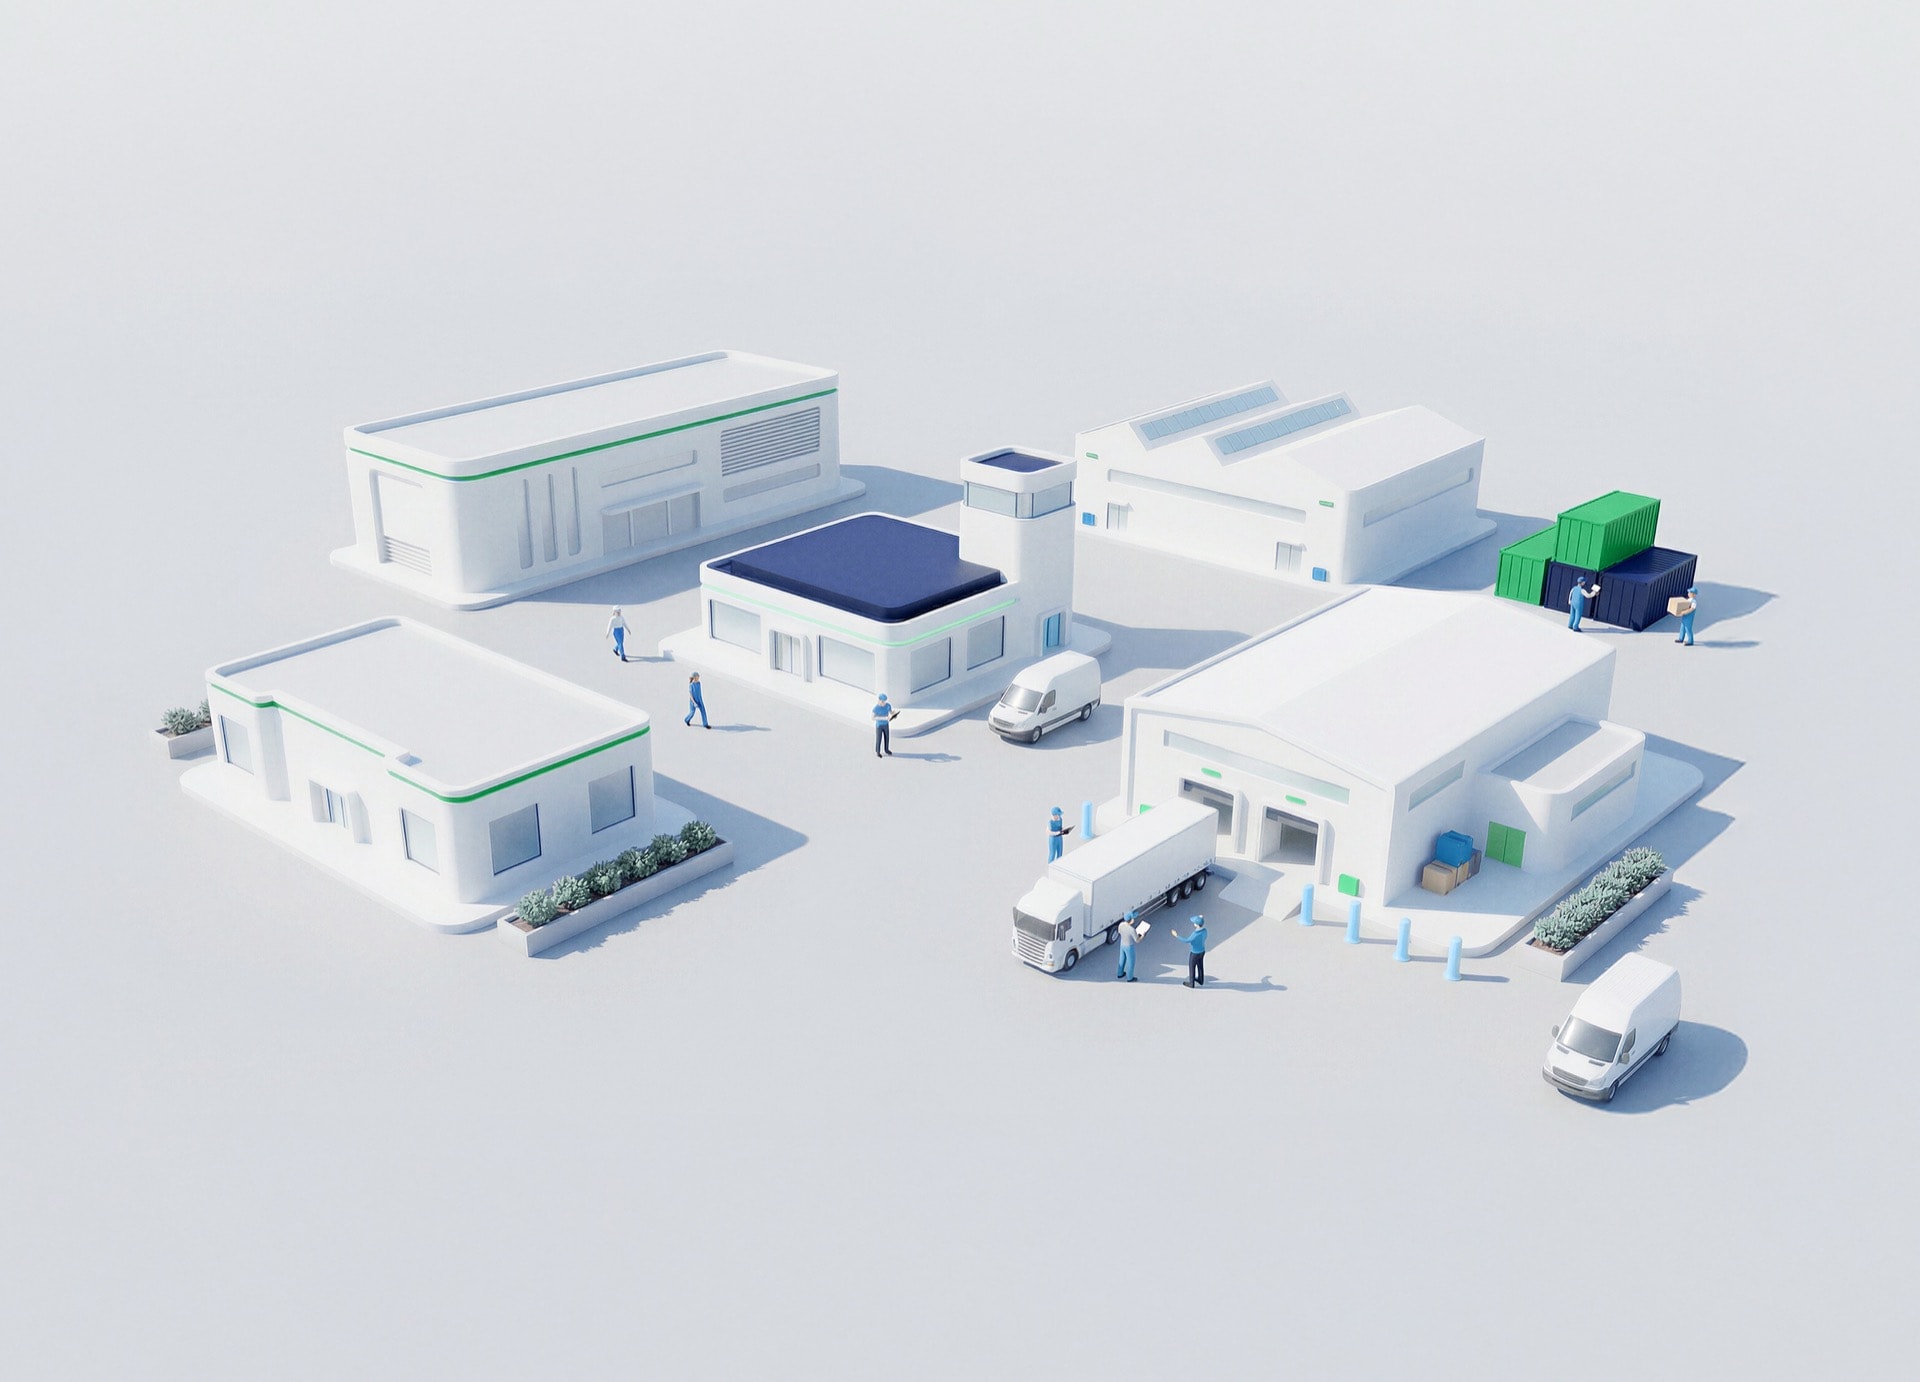


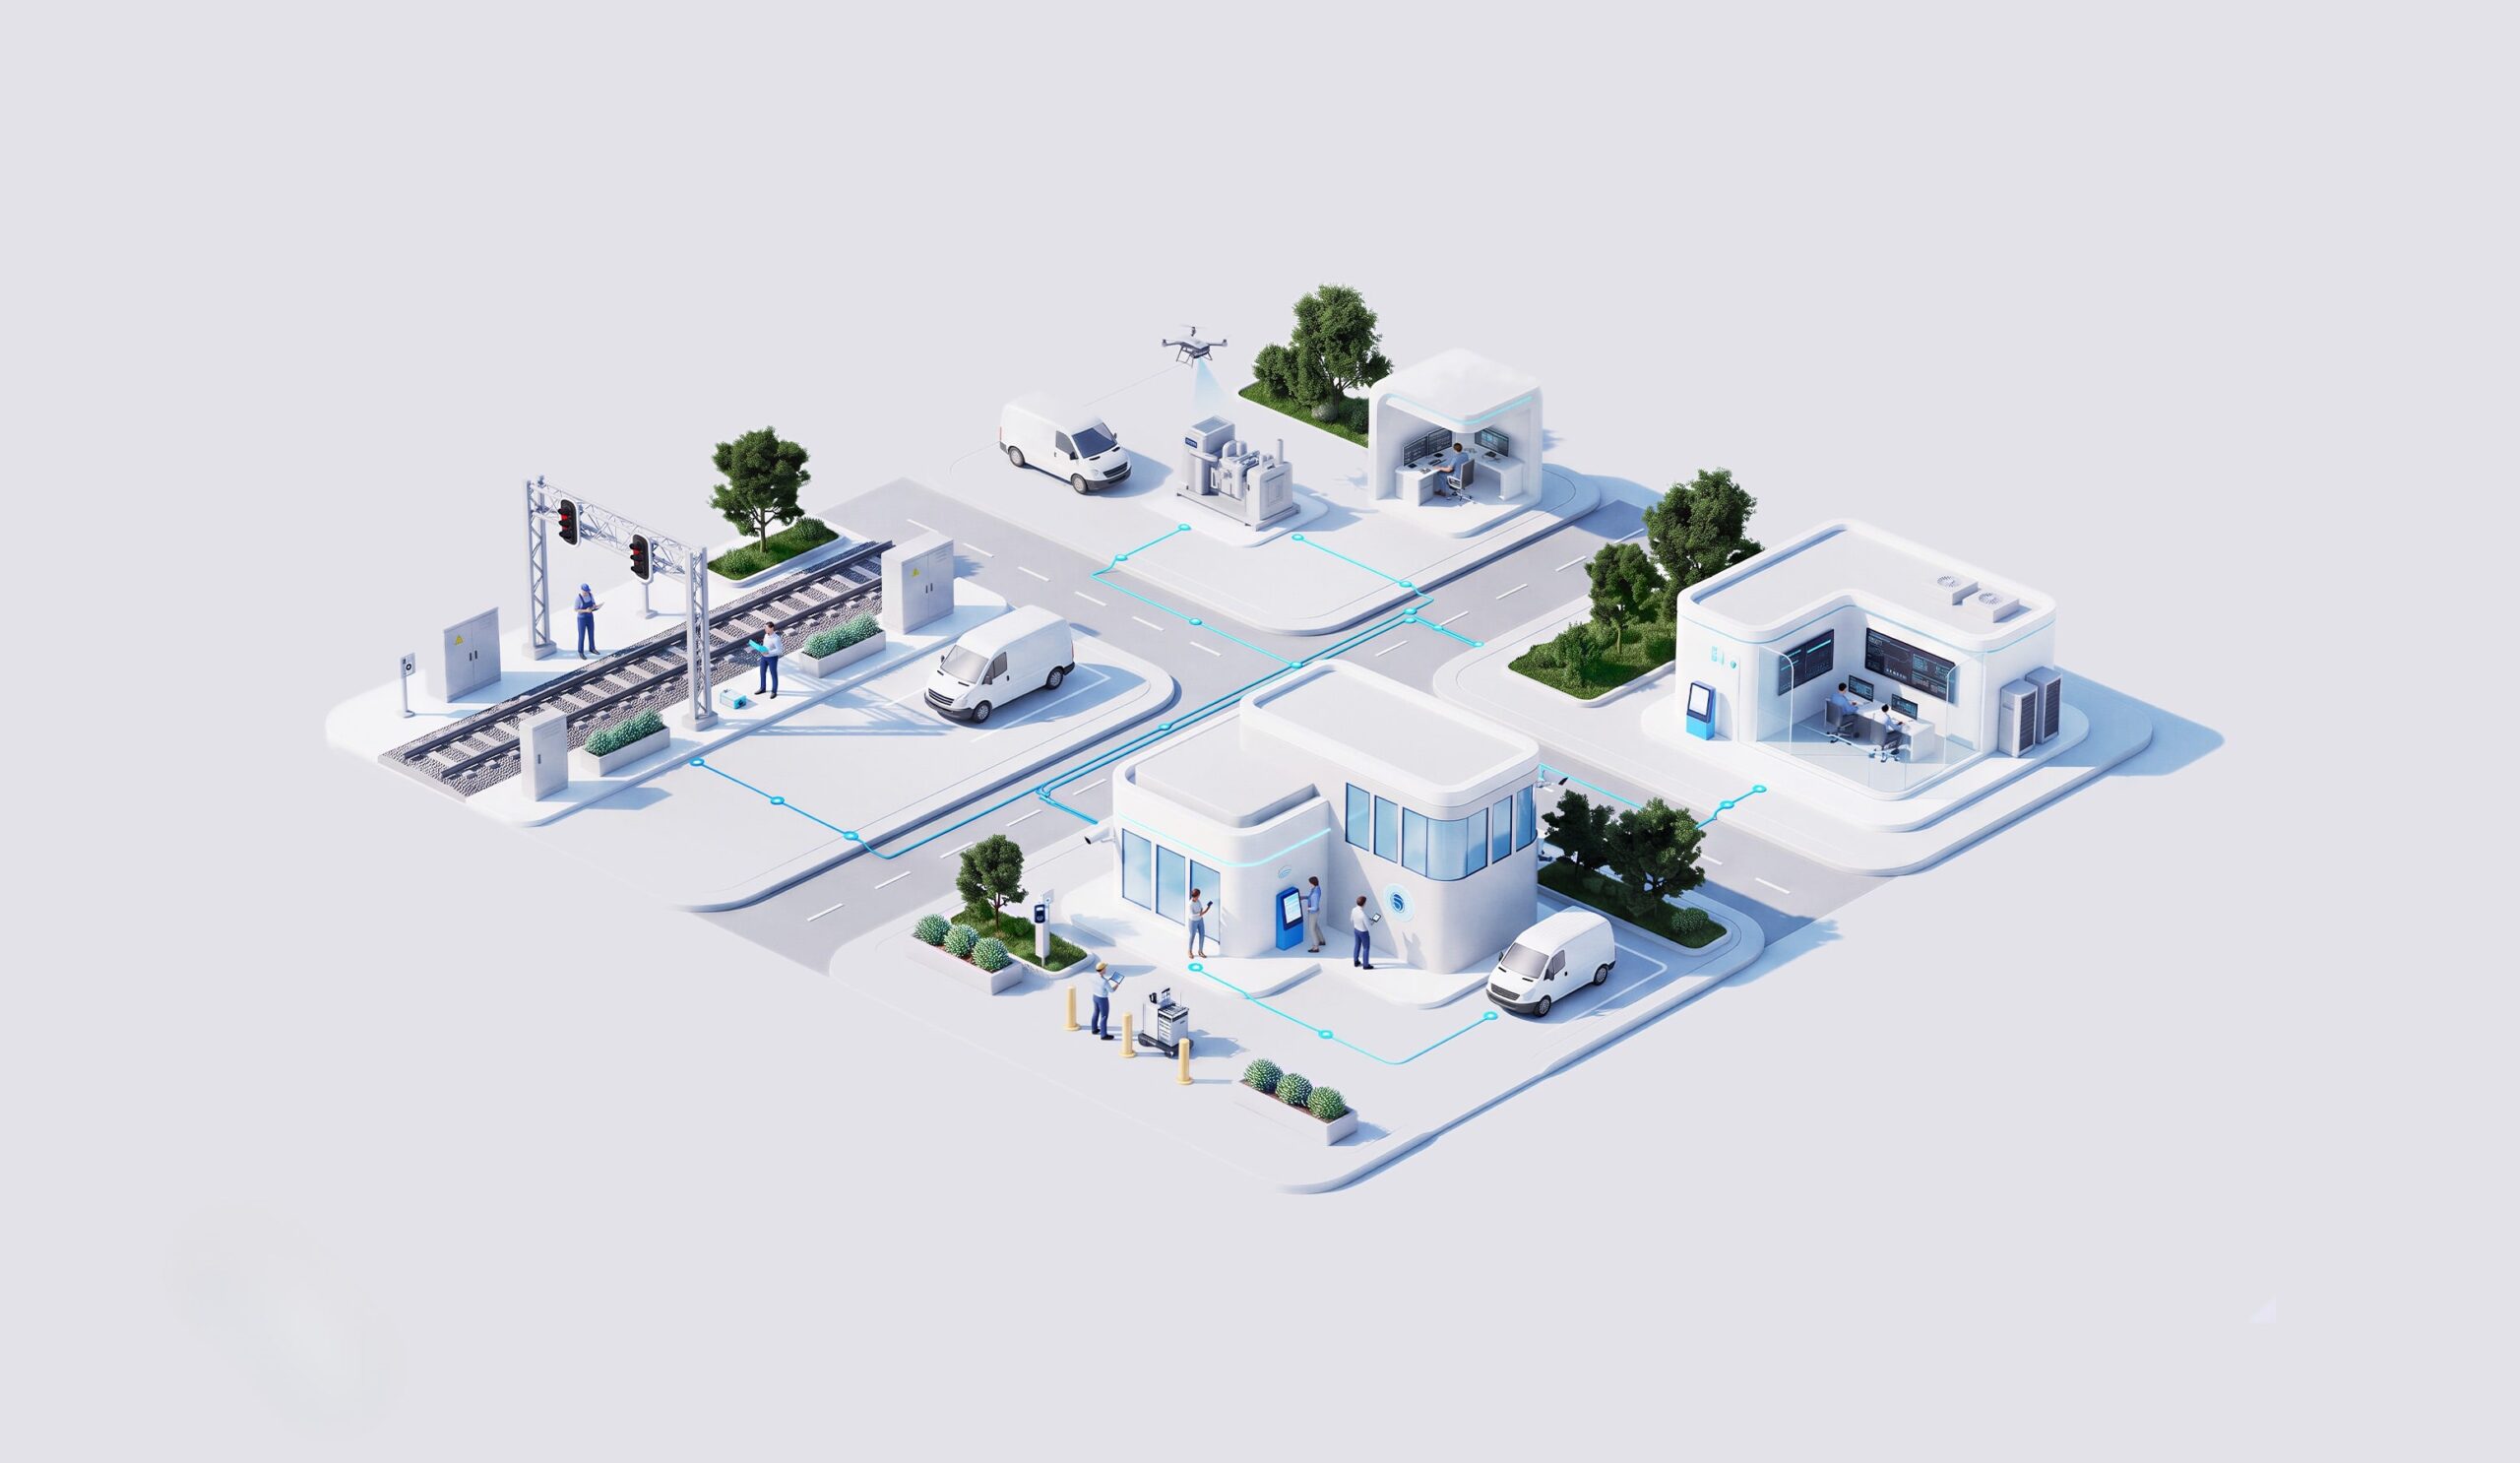



Heat stress intelligence for grid assets
Transformers, lines and substation equipment carry a thermal limit tied to ambient heat and load. Heat stress intelligence tracks this limit in near real time, so operators adjust load before equipment is pushed past what conditions allow.
Heat stress intelligence for grid assets helps you protect equipment before extreme heat affects performance.

Earlier risk detection and warning track thermal limits on transformers, lines and substation equipment in near real time.
Better prioritisation of field resources ranks substations and T&D corridors by heat stress, not a fixed schedule.
Reduced exposure of critical assets comes from adjusting load or dispatch before equipment exceeds its thermal limit.
Faster emergency preparation and response connect current temperature and load data to the assets most at risk.
NTTデータのサポート体制は?
NTT DATA brings together weather intelligence, geospatial analytics, earth observation, IoT and asset load data your heat stress model depends on.

AI/ML sits where a load management or dispatch decision happens, from a control room to a substation gate.
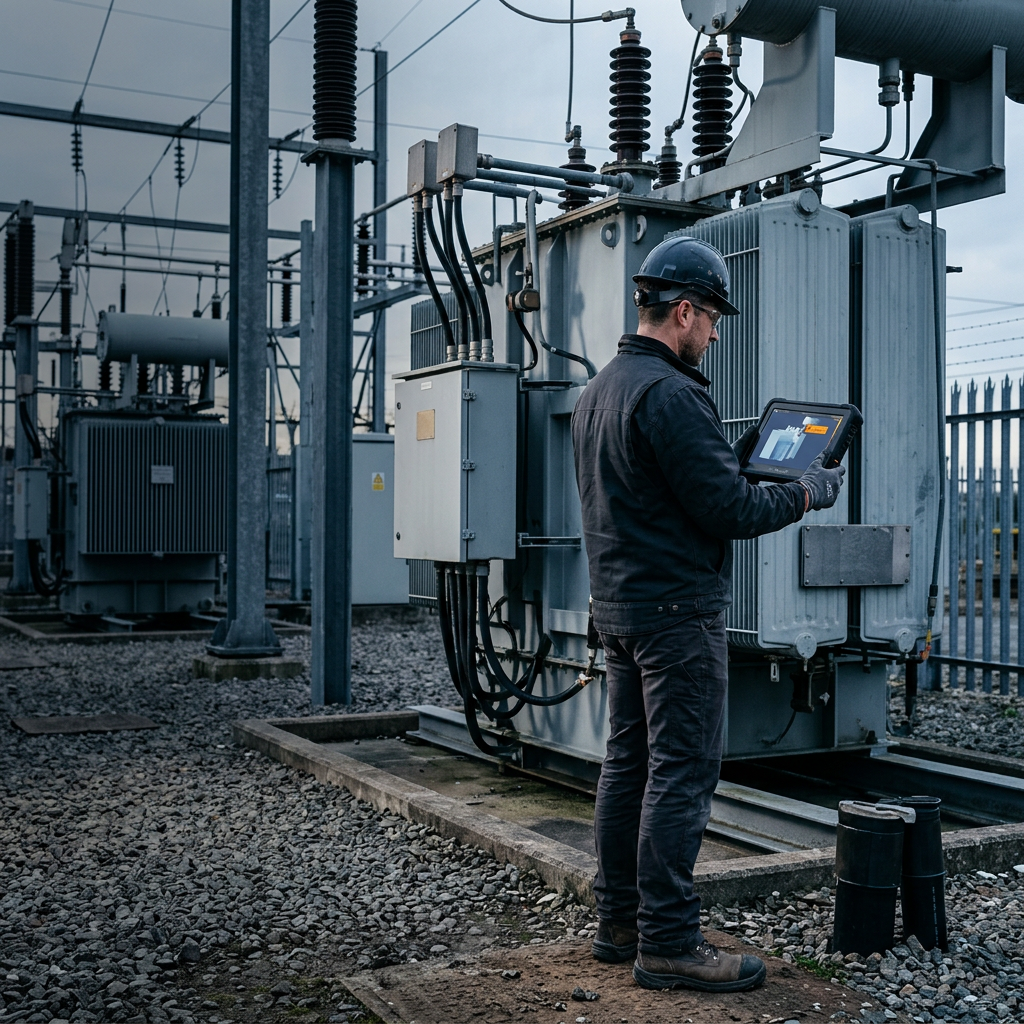
Heat stress outputs connect into your existing operational technology (OT) and enterprise systems, not another isolated layer.
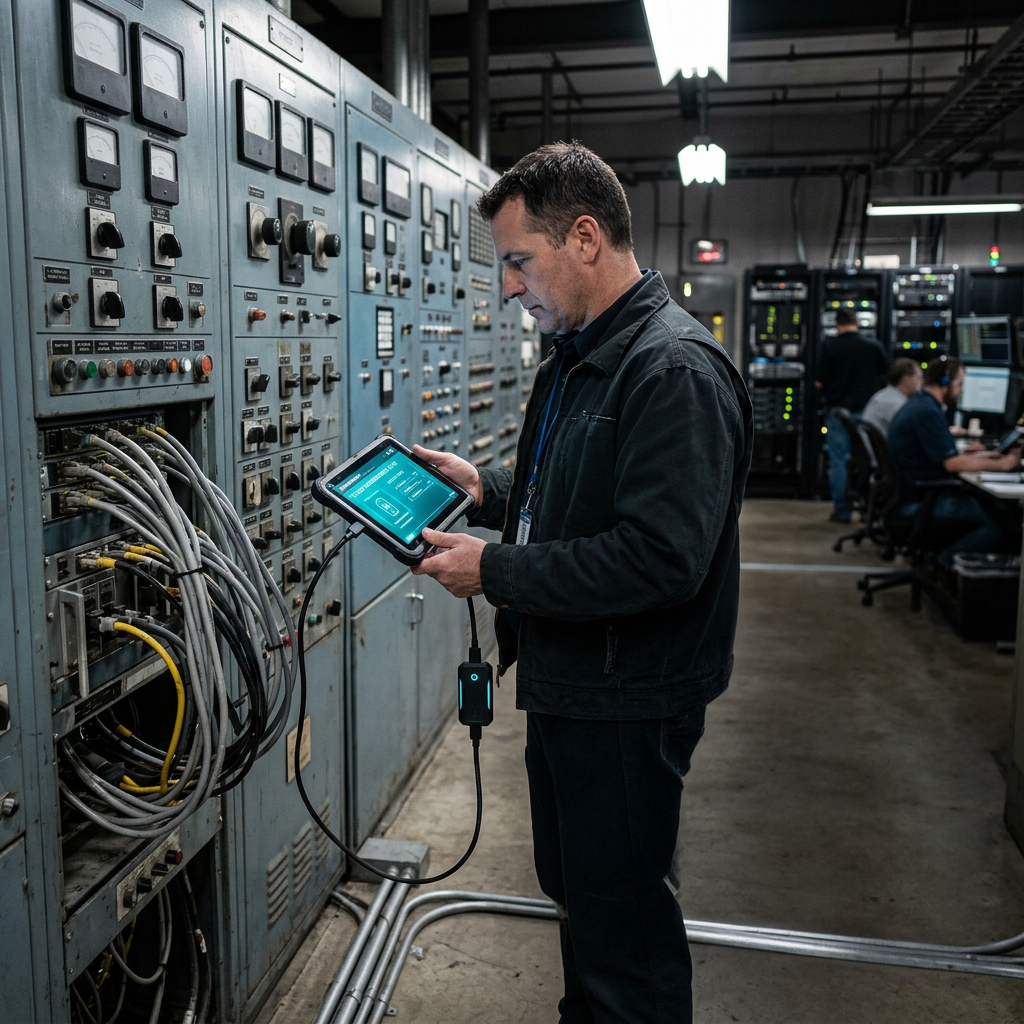
Permissions, cybersecurity controls, validation and fallback mechanisms get defined to match the safety bar your operations require.

Each new heat stress use case grows from a controlled deployment measured against clear operational KPIs, so scale-up follows evidence, not guesswork.

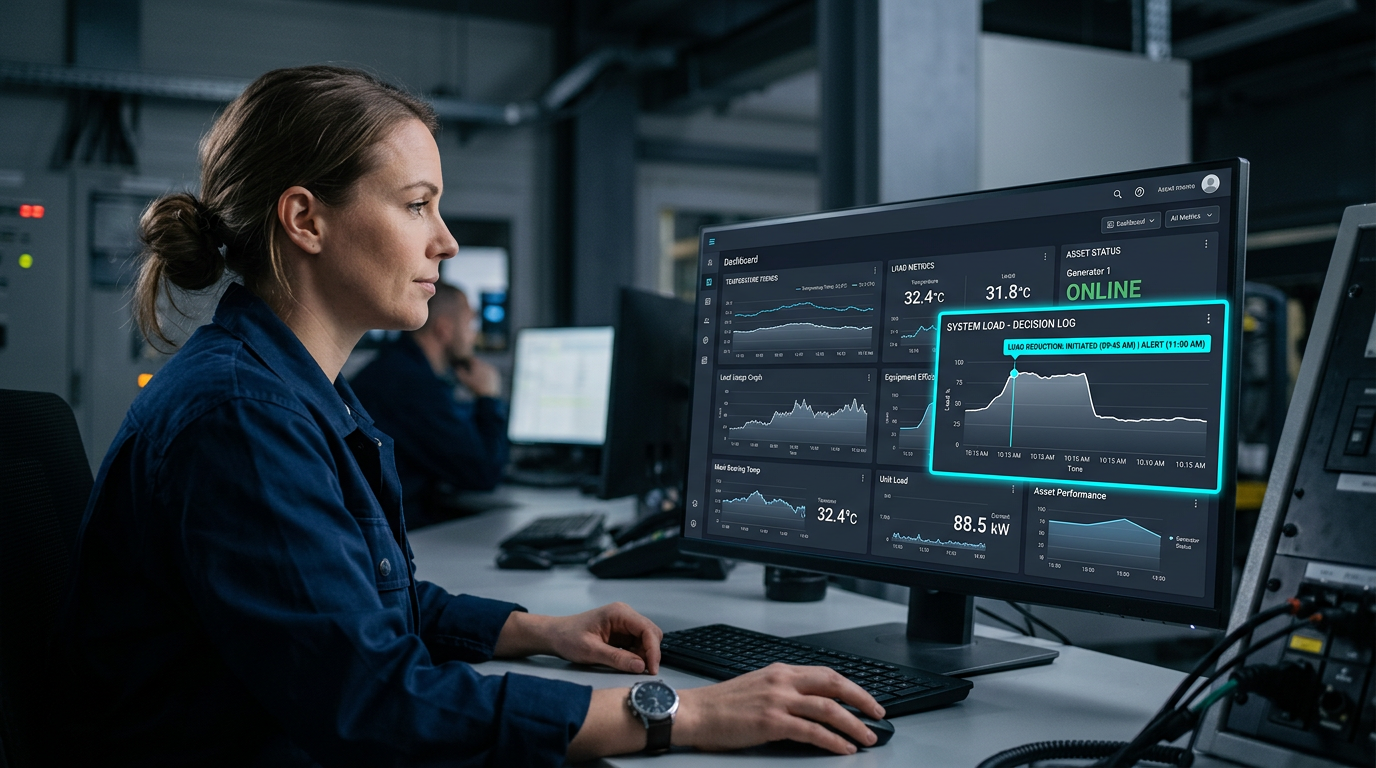
Heat stress intelligence connects weather, load and asset data so operators act before extreme heat affects grid performance.
Objectives depend on baseline performance, infrastructure and deployment scope across climate-risk operations.
20% to 40% reduction in risk assessment time, reflecting quicker movement from temperature data to a decision.
15% to 30% improvement in warning lead time, giving operators more time to adjust load before limits are reached.
30% to 50% reduction in manual geospatial review, freeing analysts to focus on the hottest zones.
20% to 40% reduction in response preparation time, reflecting quicker movement from warning to action.
Shape the conversation that keeps grid assets reliable through extreme heat.