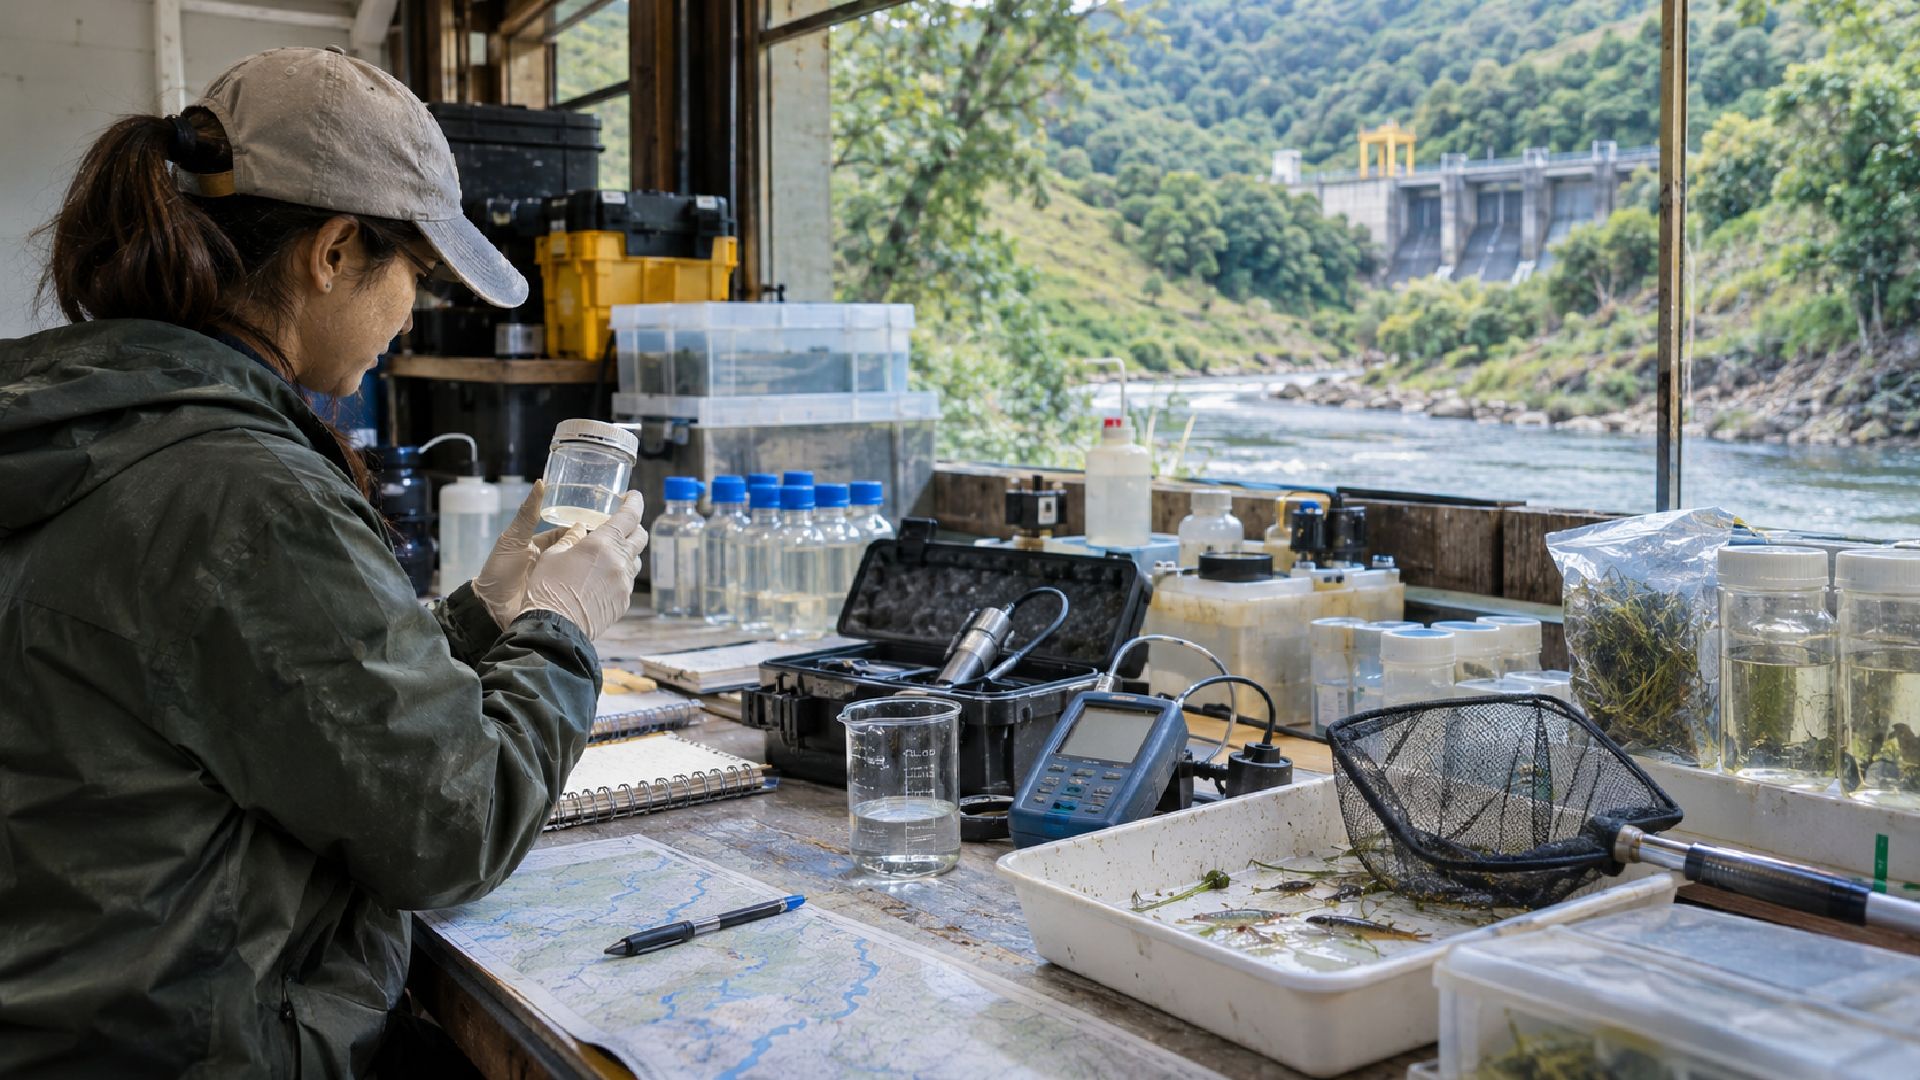
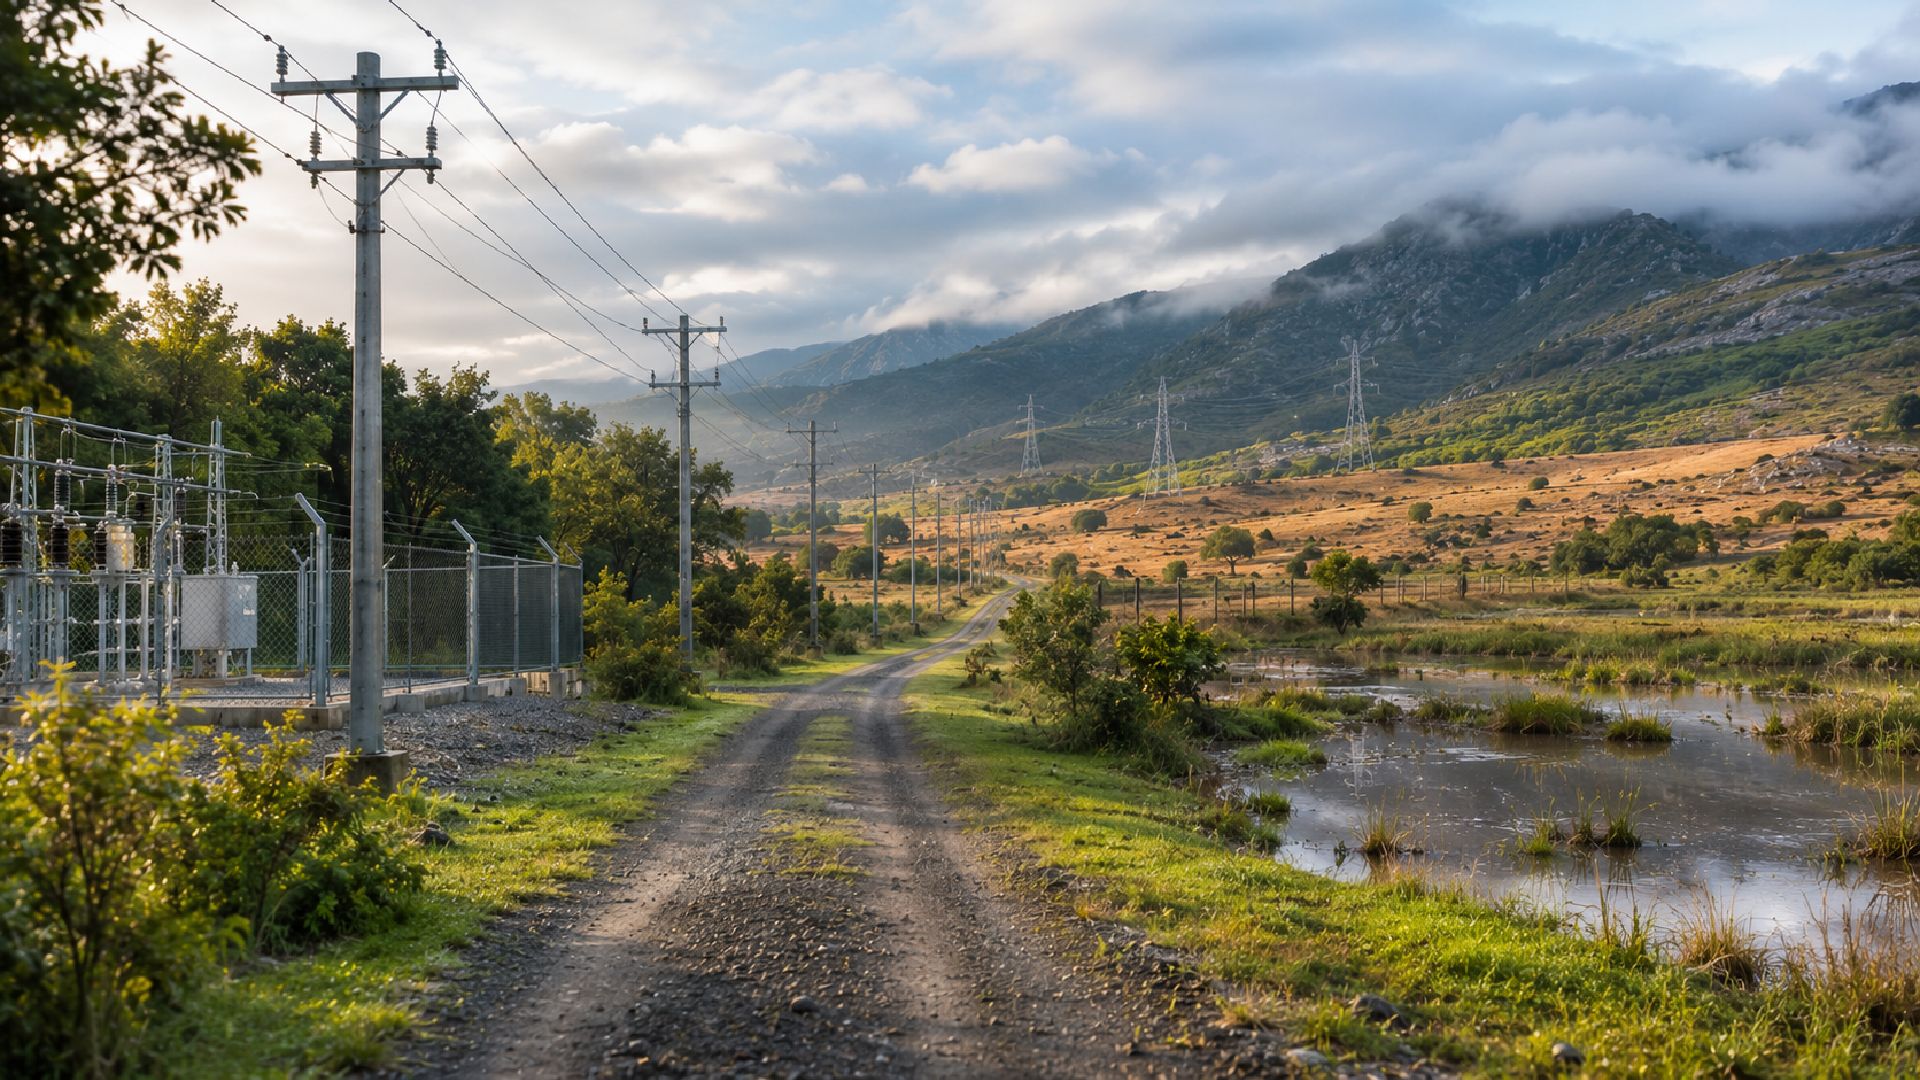
Water Quality and Aquatic Biota Monitoring for Hydropower Infrastructure
Hydropower construction changes how river systems must be observed and interpreted over time. When seasonal variability can resemble project-related change, environmental decisions depend on a monitoring record consistent enough to separate natural patterns from signals that require closer investigation. NTT DATA supported a multi-year monitoring programme for a hydropower project in Chile, combining physicochemical water analysis, aquatic-biota monitoring and multivariate statistics across repeated campaigns. The work created a longitudinal evidence base spanning water quality and biological communities, supporting environmental follow-up throughout the project.
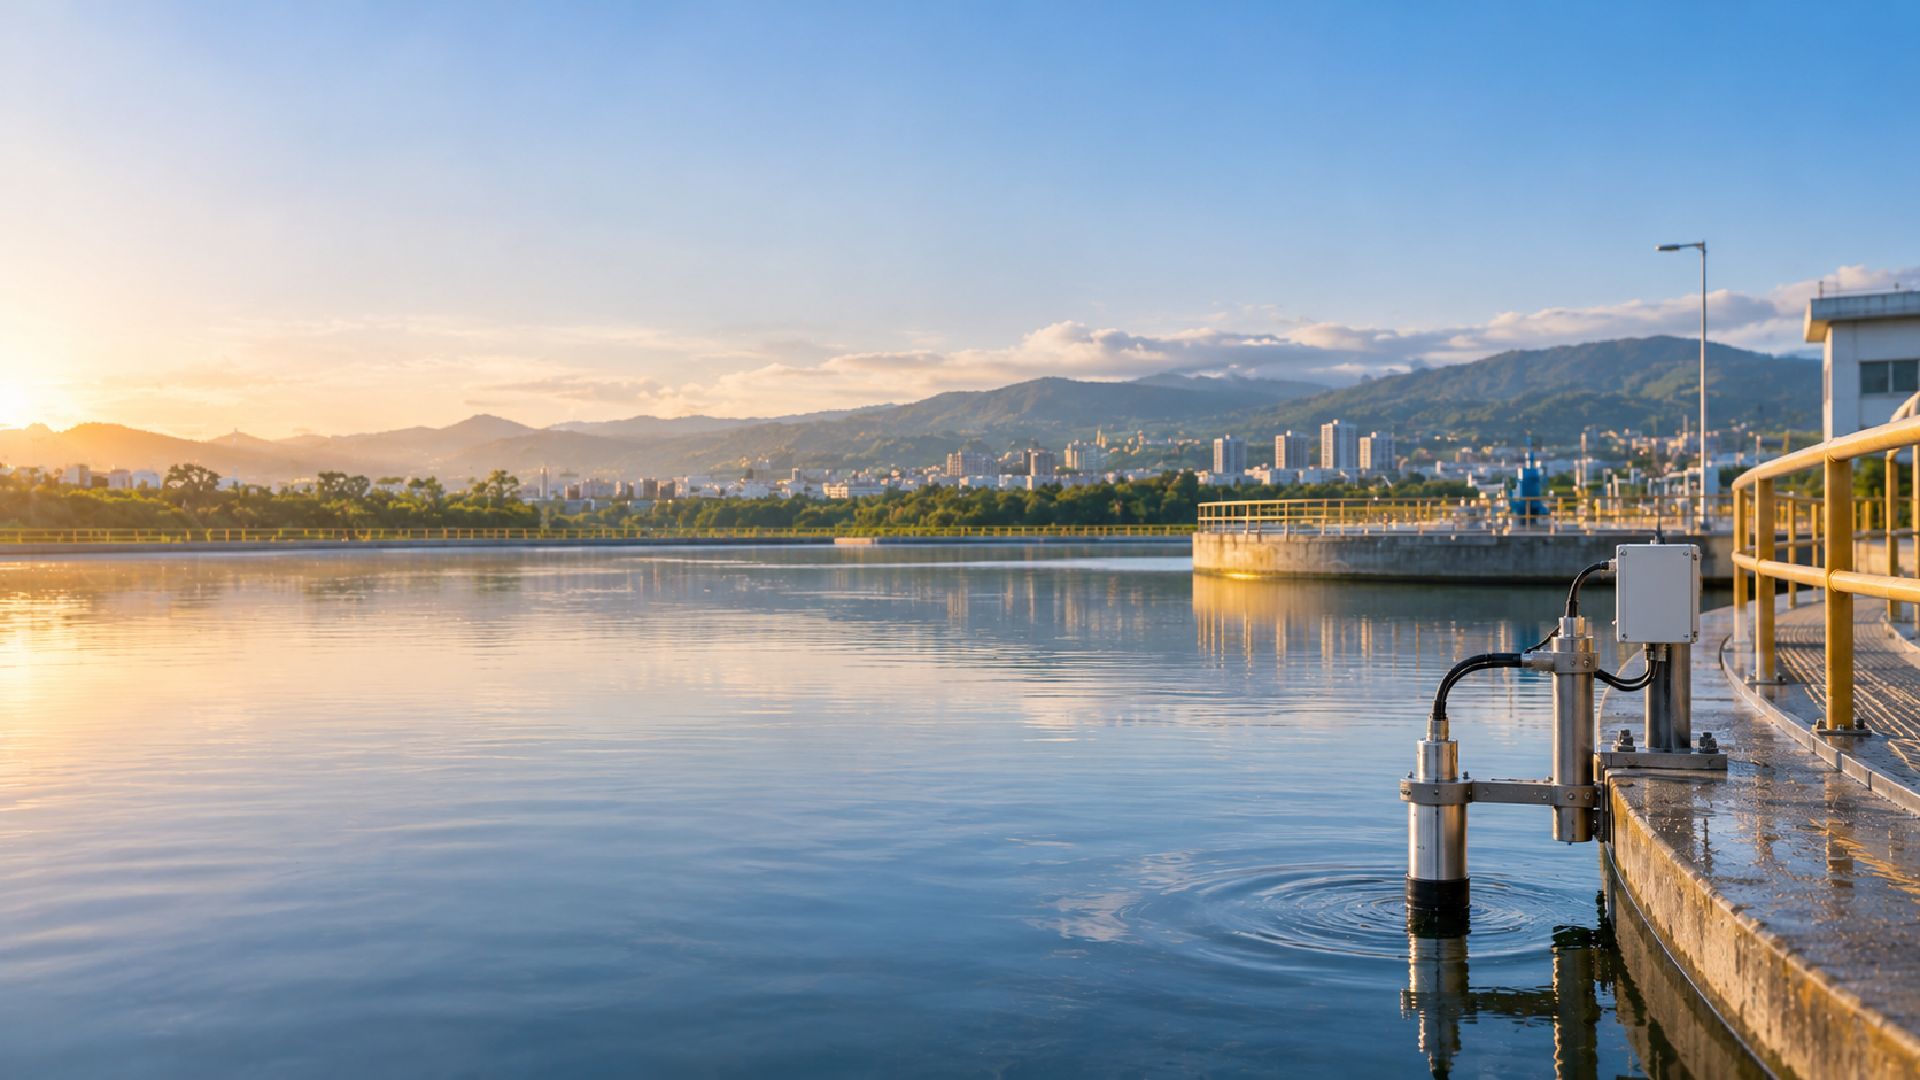
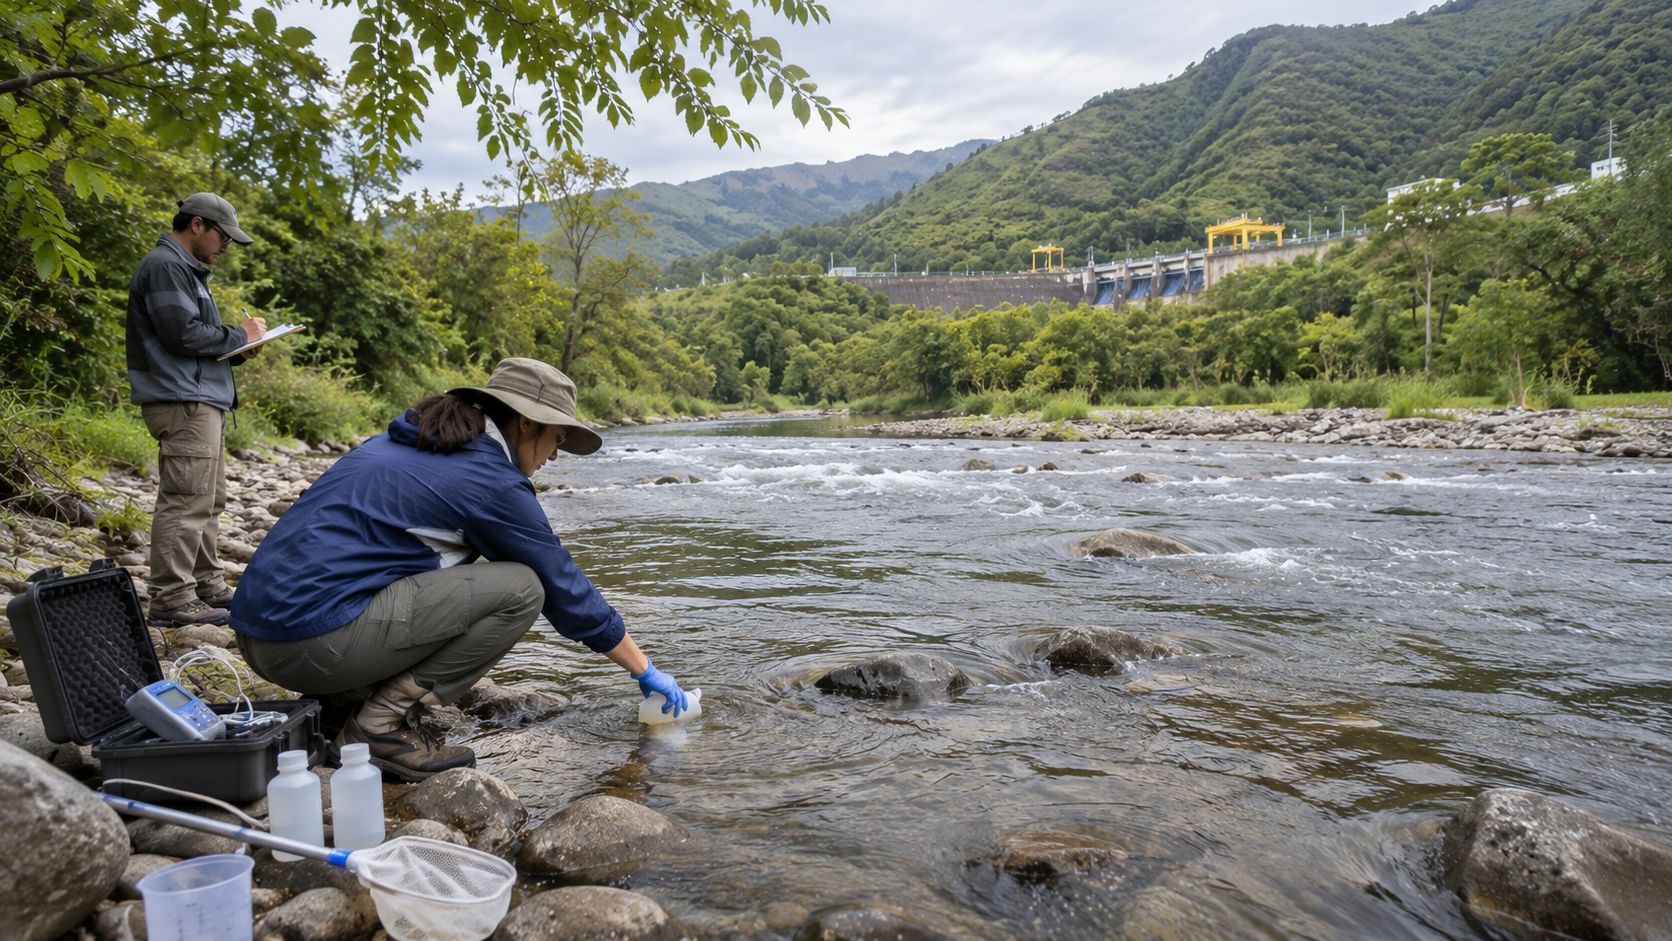
Environmental monitoring along a river near hydropower infrastructure, with field equipment used to assess water quality and aquatic ecosystem conditions.
Monitoring duration
Four years
Monitoring network
19 stations
Project value
EUR445,000
Monitoring cadence
Quarterly campaigns
Environmental field station with water quality samples, aquatic monitoring equipment and field records used to compare river conditions across repeated monitoring campaigns.
Building a consistent evidence base for environmental change around hydropower infrastructure

Repeated field campaigns, stable monitoring locations and comparable analytical methods allowed the programme to track river conditions across seasons and years. Physicochemical measurements were assessed alongside multiple aquatic communities, while ecological indicators and multivariate analysis provided a structured way to compare results over time. This combined view supported interpretation of environmental change without relying on a single parameter or isolated sampling event.

Connecting water quality and aquatic ecology across four years of monitoring
Objectives
Determine whether construction activity was associated with changes in water-quality parameters or aquatic biota by establishing a consistent, repeatable evidence base. The programme needed to compare conditions across seasons and years using stable monitoring stations, standardised sampling and laboratory analysis, while combining biological and physicochemical indicators to distinguish project-related signals from natural variability.
Opportunity
Hydropower operators need environmental monitoring that moves beyond isolated samples and provides a defensible record of how river conditions evolve. Combining repeated physicochemical measurements with biological indicators creates a broader basis for interpreting change, identifying deviations that warrant investigation and supporting environmental management decisions. The same longitudinal record can also provide context for later hydrological or temperature-driven changes, although the source documents project monitoring rather than a climate-adaptation intervention.
Creating comparable environmental evidence across seasons and years

A multi-year programme had to keep field methods comparable while accounting for natural seasonal variation, multiple biological communities and ecological data that do not fit simple statistical assumptions.
Key Challenges
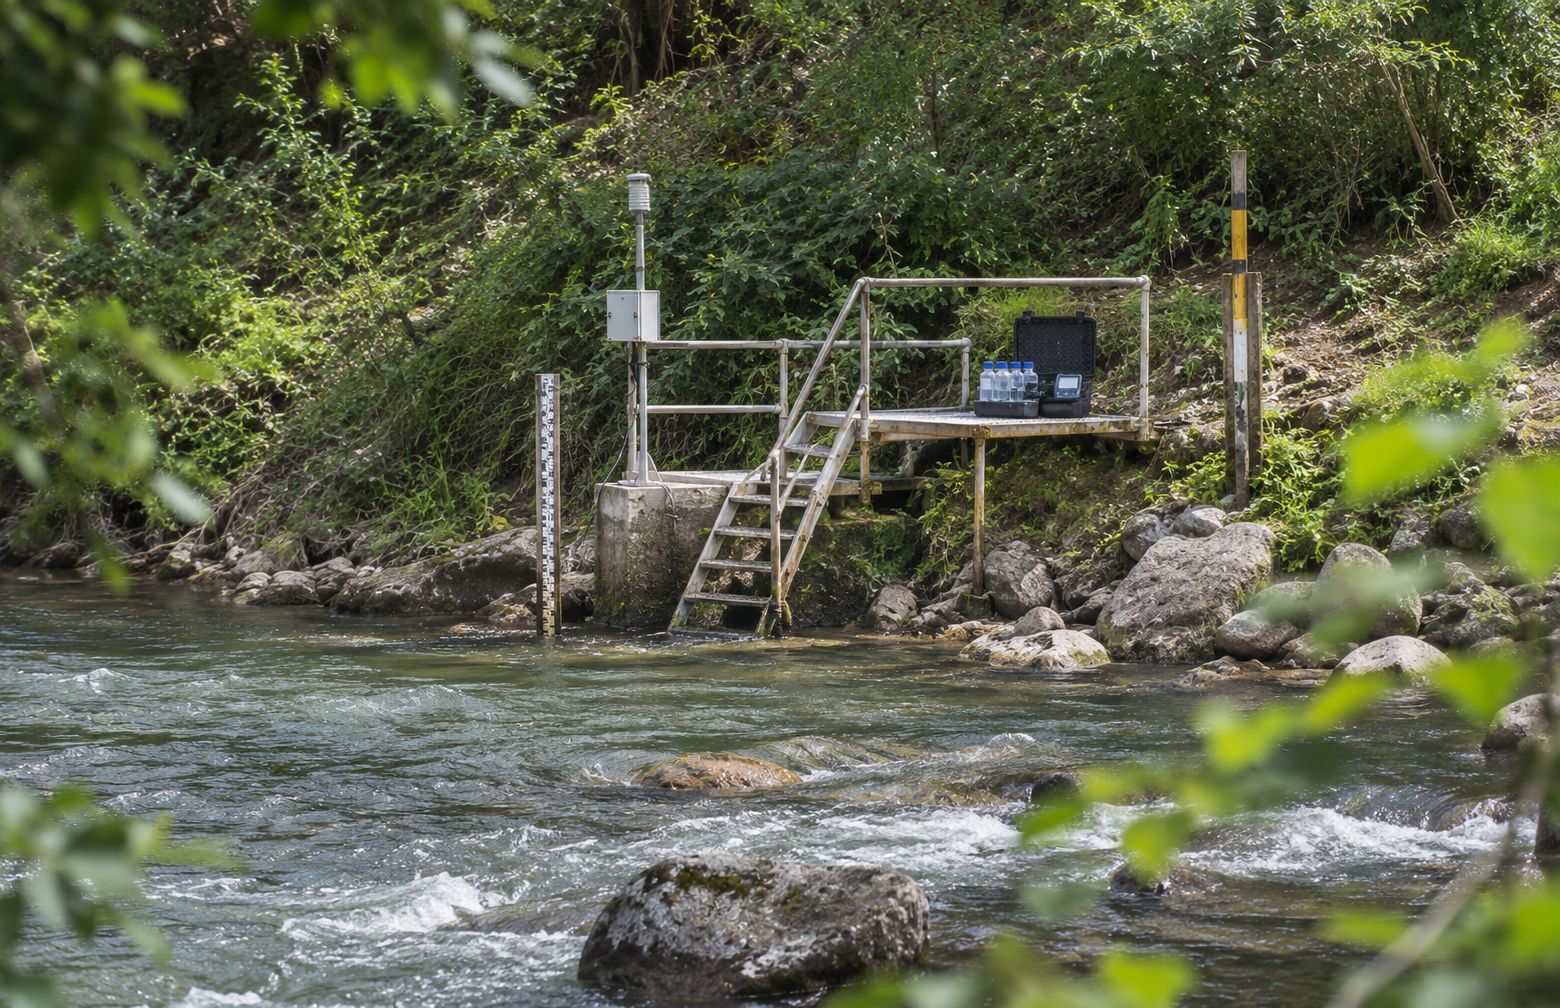
Permanent river monitoring station with fixed sampling points and standardized field equipment supporting consistent water quality measurements across repeated campaigns.
1. Maintain monitoring consistency over time
Repeated campaigns needed stable station locations and comparable methods so changes could be interpreted against a consistent baseline rather than shifts in sampling design.
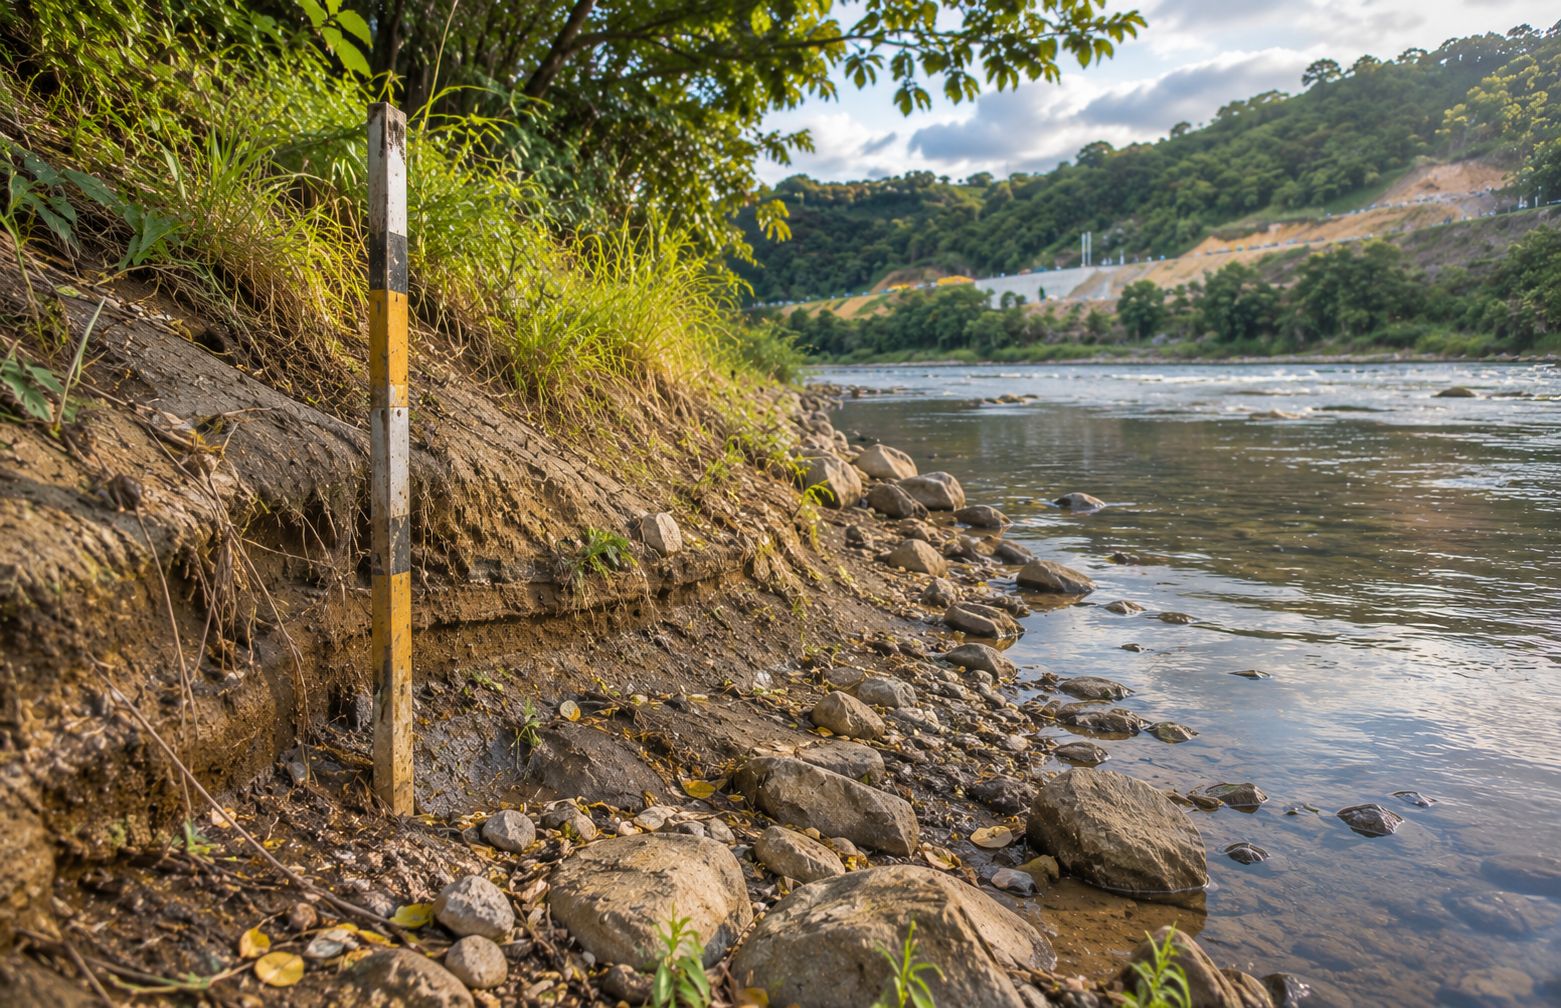
Riverbank with seasonal waterline marks, exposed sediment and vegetation used to distinguish natural river variability from possible project-related environmental change.
2. Separate seasonal from project-related change
River conditions naturally vary by season. The analysis therefore needed to distinguish expected variability from patterns that could be associated with construction activity.
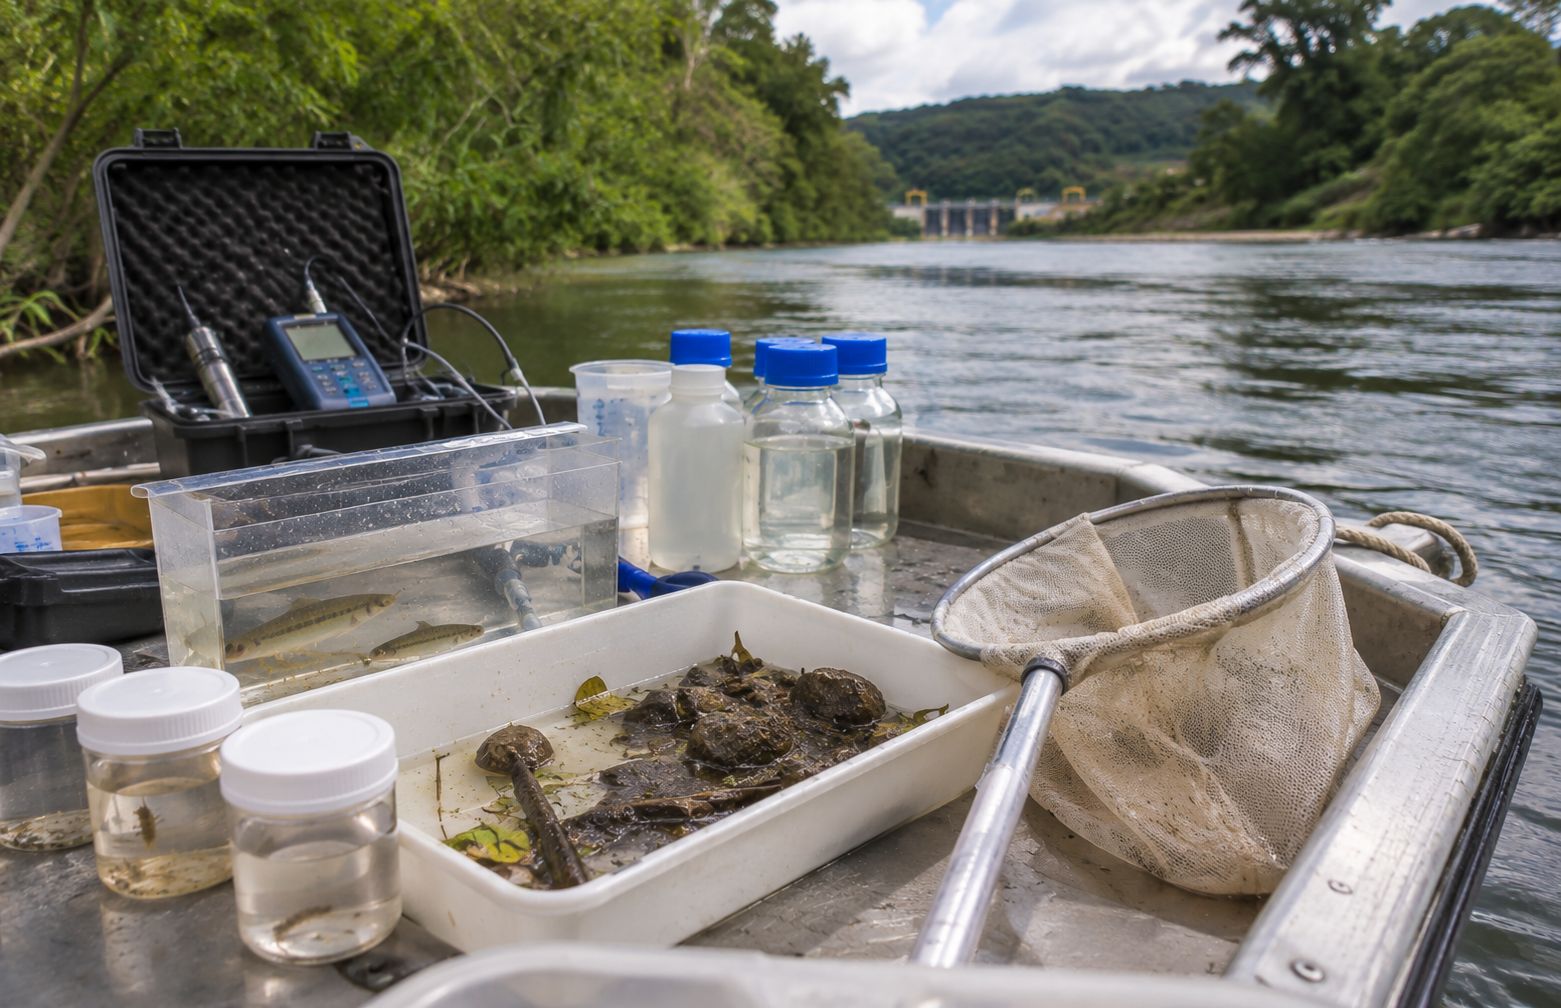
Aquatic monitoring platform with water samples, plankton equipment, benthic material and fish observations used to assess river water quality and biodiversity together.
3. Integrate water and biological evidence
Physicochemical measurements alone could not describe the full environmental condition. The programme also needed to assess phytobenthos, phytoplankton, zoobenthos, zooplankton and fish alongside biodiversity indicators.
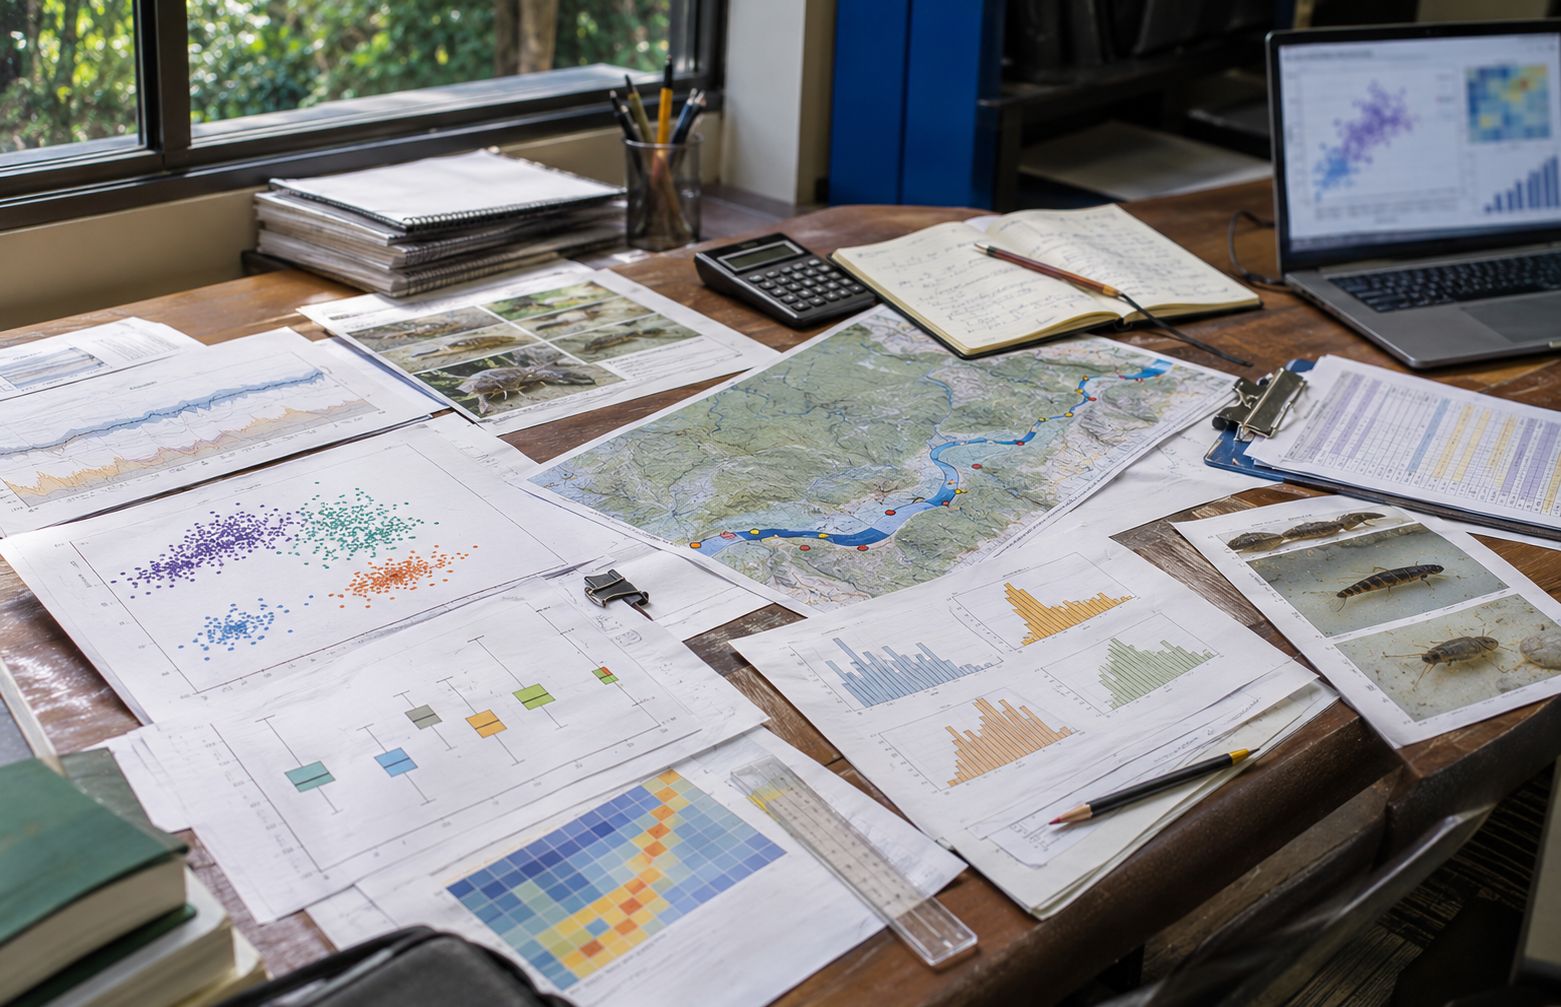
Ecological monitoring data, biodiversity records and statistical plots being compared across repeated river sampling campaigns to analyse richness, abundance and diversity.
4. Analyse complex ecological datasets
Richness, abundance and diversity data across repeated campaigns required statistical techniques suitable for non-parametric, multivariate ecological datasets.
Solution
A four-year monitoring framework combining field, laboratory and ecological analysis

NTT DATA structured quarterly monitoring across 19 stations, combining water sampling, laboratory analysis and aquatic-biota surveys. The programme used richness, total abundance and Shannon diversity as ecological indicators and applied non-parametric multivariate analysis to compare seasonal campaigns, creating a consistent record for environmental follow-up and interpretation over time.

check icon
Quarterly monitoring network

NTT DATA maintained quarterly field campaigns across 19 monitoring stations over four years, creating repeated observations from a stable monitoring footprint.

check icon
Standardised water-quality analysis

Water samples were collected through repeated campaigns and analysed in the laboratory against the applicable national water-quality standard, supporting comparable physicochemical assessment.

check icon
Multi-community aquatic biota monitoring

The programme assessed phytobenthos, phytoplankton, zoobenthos, zooplankton and fish, extending the evidence base beyond water chemistry.

check icon
Multivariate ecological interpretation

Richness, total abundance and Shannon diversity were evaluated using non-parametric multivariate analysis to compare conditions across seasonal campaigns and support interpretation of change over time.

Impact
Four years of quarterly monitoring across 19 stations created a longitudinal environmental evidence base.

The source documents four years of quarterly monitoring across 19 stations and a project value of EUR445,000. These figures establish programme duration, monitoring footprint and delivery scale. The documented outcome is a longitudinal record spanning water quality and aquatic biota; the source does not quantify an improvement in environmental performance or attribute specific ecological changes to the programme.

Drag