- All Foundries

- Commodity Management & Trading

- Customer & Marketing Strategy

- Digital Engineering

- Station Studio

- Supply Chain & Industry 5.0

- Sustainability

- Physical AI

- Next-Gen Infrastructure





Climate Adaptation Roadmaps for Utilities
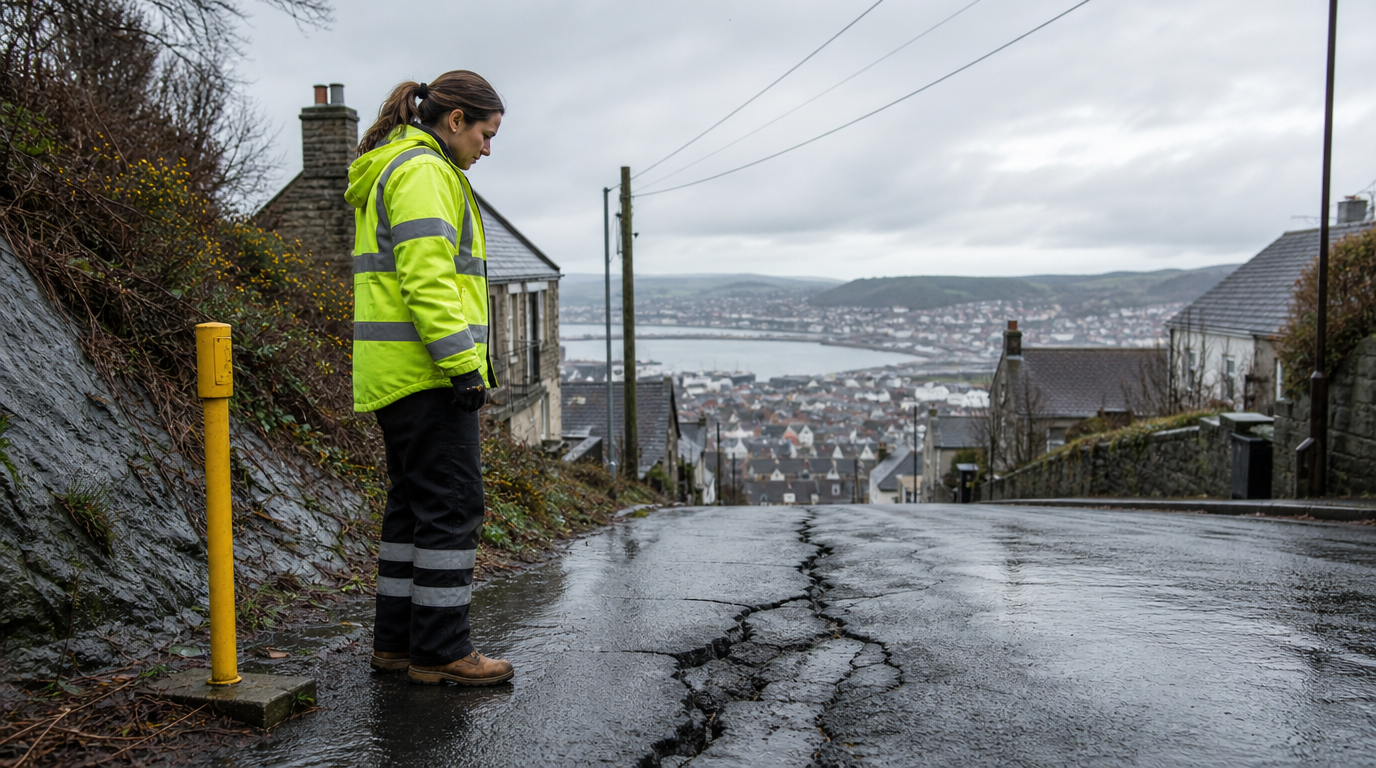
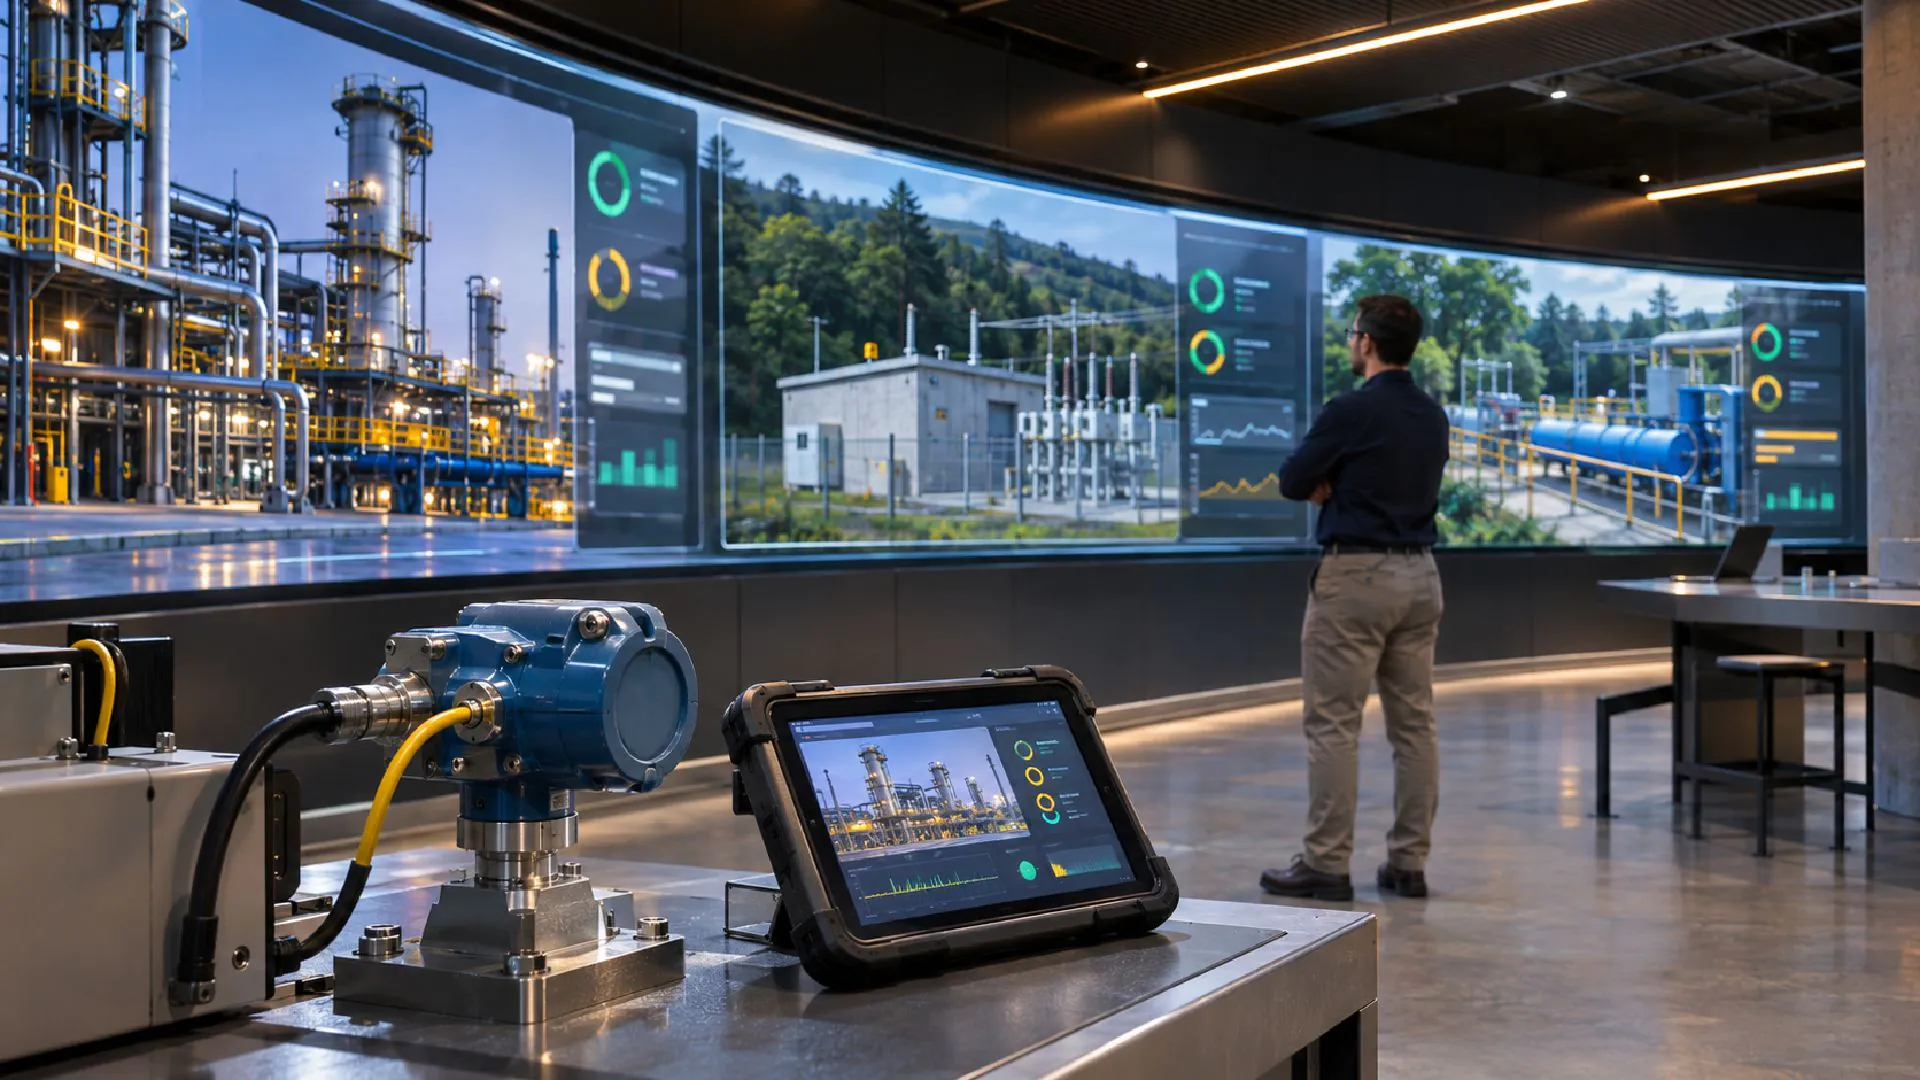
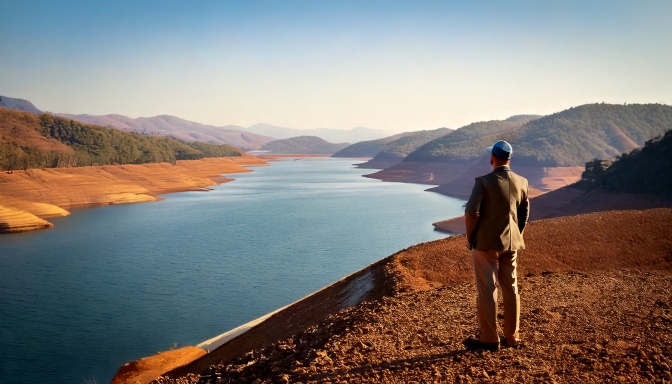
Heat, flooding and water stress hit generation and industrial assets differently by site. A roadmap links climate scenarios to vulnerabilities and existing measures, and sequences actions from 2030 to 2050 under clear governance.
The roadmap turns scenario data into priorities your investment committee and operations teams act on.

Climate scenarios feed the same decisions as your capital plan and maintenance budget.
Adaptation measures get ordered by exposure and business materiality, site by site.
A repeatable model applies across sites and geographies, with owners and review points.
Generation and industrial assets exposed to heat, flooding or water stress get attention first.
How NTT DATA helps
Climate-scenario analytics translate global projections into heat, rainfall and water conditions at each of your sites.
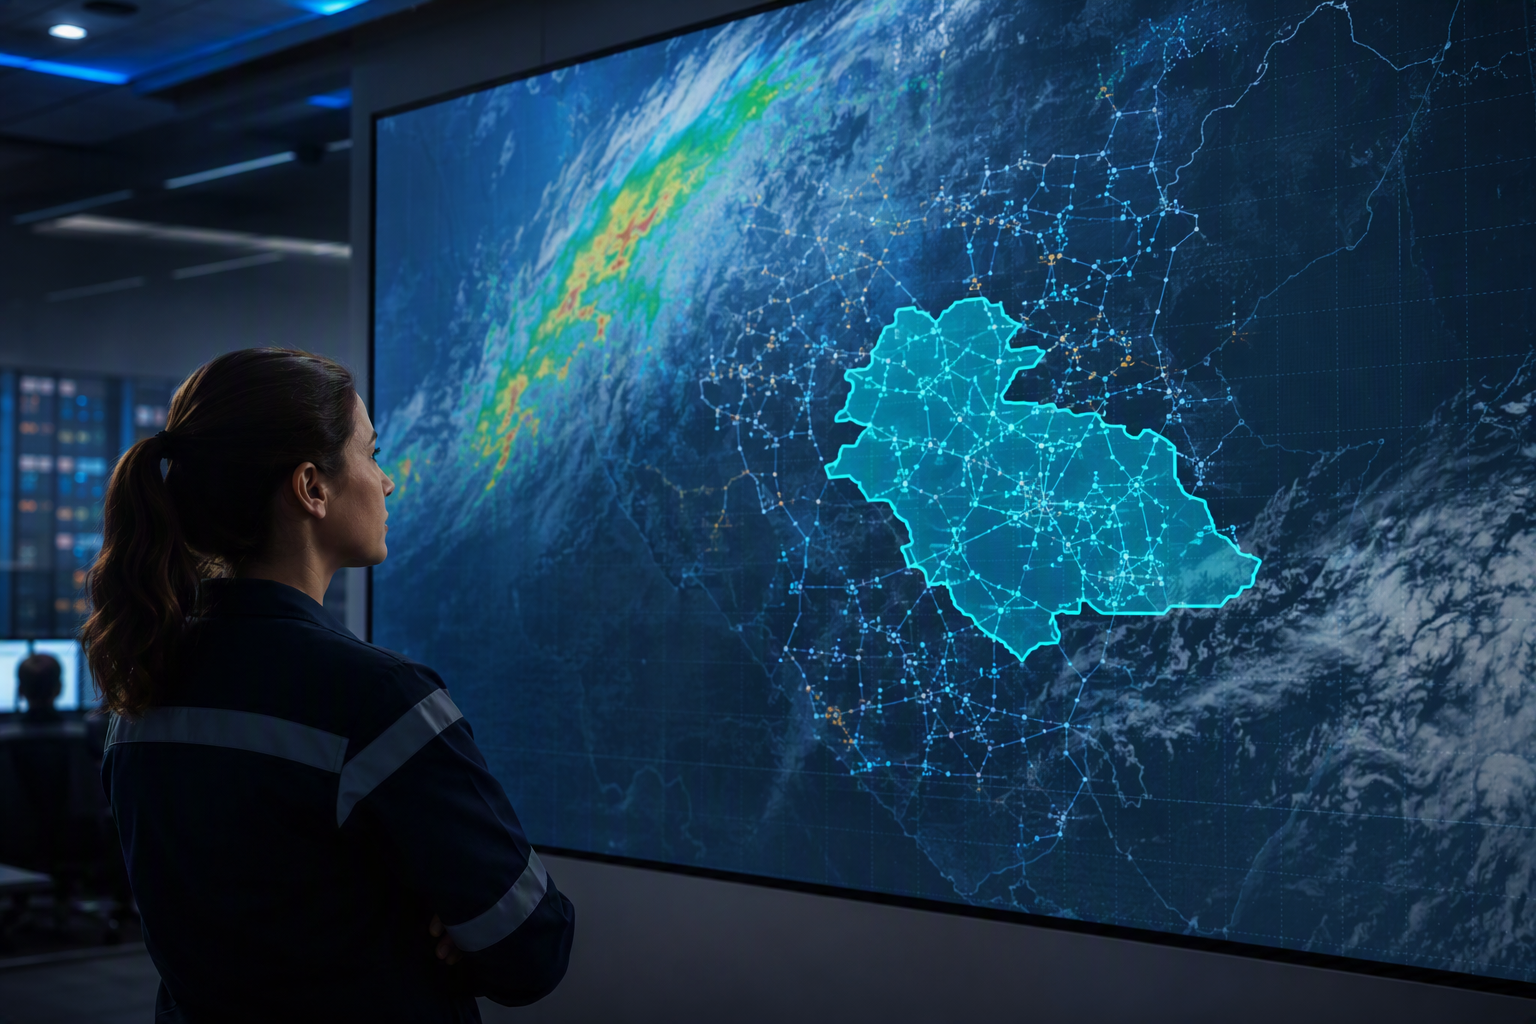
Vulnerability assessment and geospatial risk analysis show which assets suffer most under each scenario, and why.

NTT DATA inventories the controls already in place and finds where they fall short of future climate conditions.

Adaptation planning defines the objectives and risk appetite your board signs off, so every trade-off stays explicit.

Roadmap and governance design sequence actions to 2050, with owners, budgets and monitoring indicators for each phase.


Scenarios, vulnerabilities and current measures come together in one plan, with each investment tied to the climate risk behind the spend.
Targets get agreed with your strategy and asset teams and reviewed at each roadmap milestone.
Each adaptation budget line traces back to a scenario and a vulnerability.
The highest-exposure assets get funded and scheduled first.
Every site follows the same review cycle and reporting format.
Monitoring shows which actions are complete and where exposure has dropped.
Join the dialogue that turns climate scenarios into a 2030-2050 adaptation roadmap for your utility.